After gaining the basic graphic design knowledge at university, I applied and expanded on my skills thanks to a number of different projects, from promotional graphics to data visualization.
2021 Formula 1 season recap
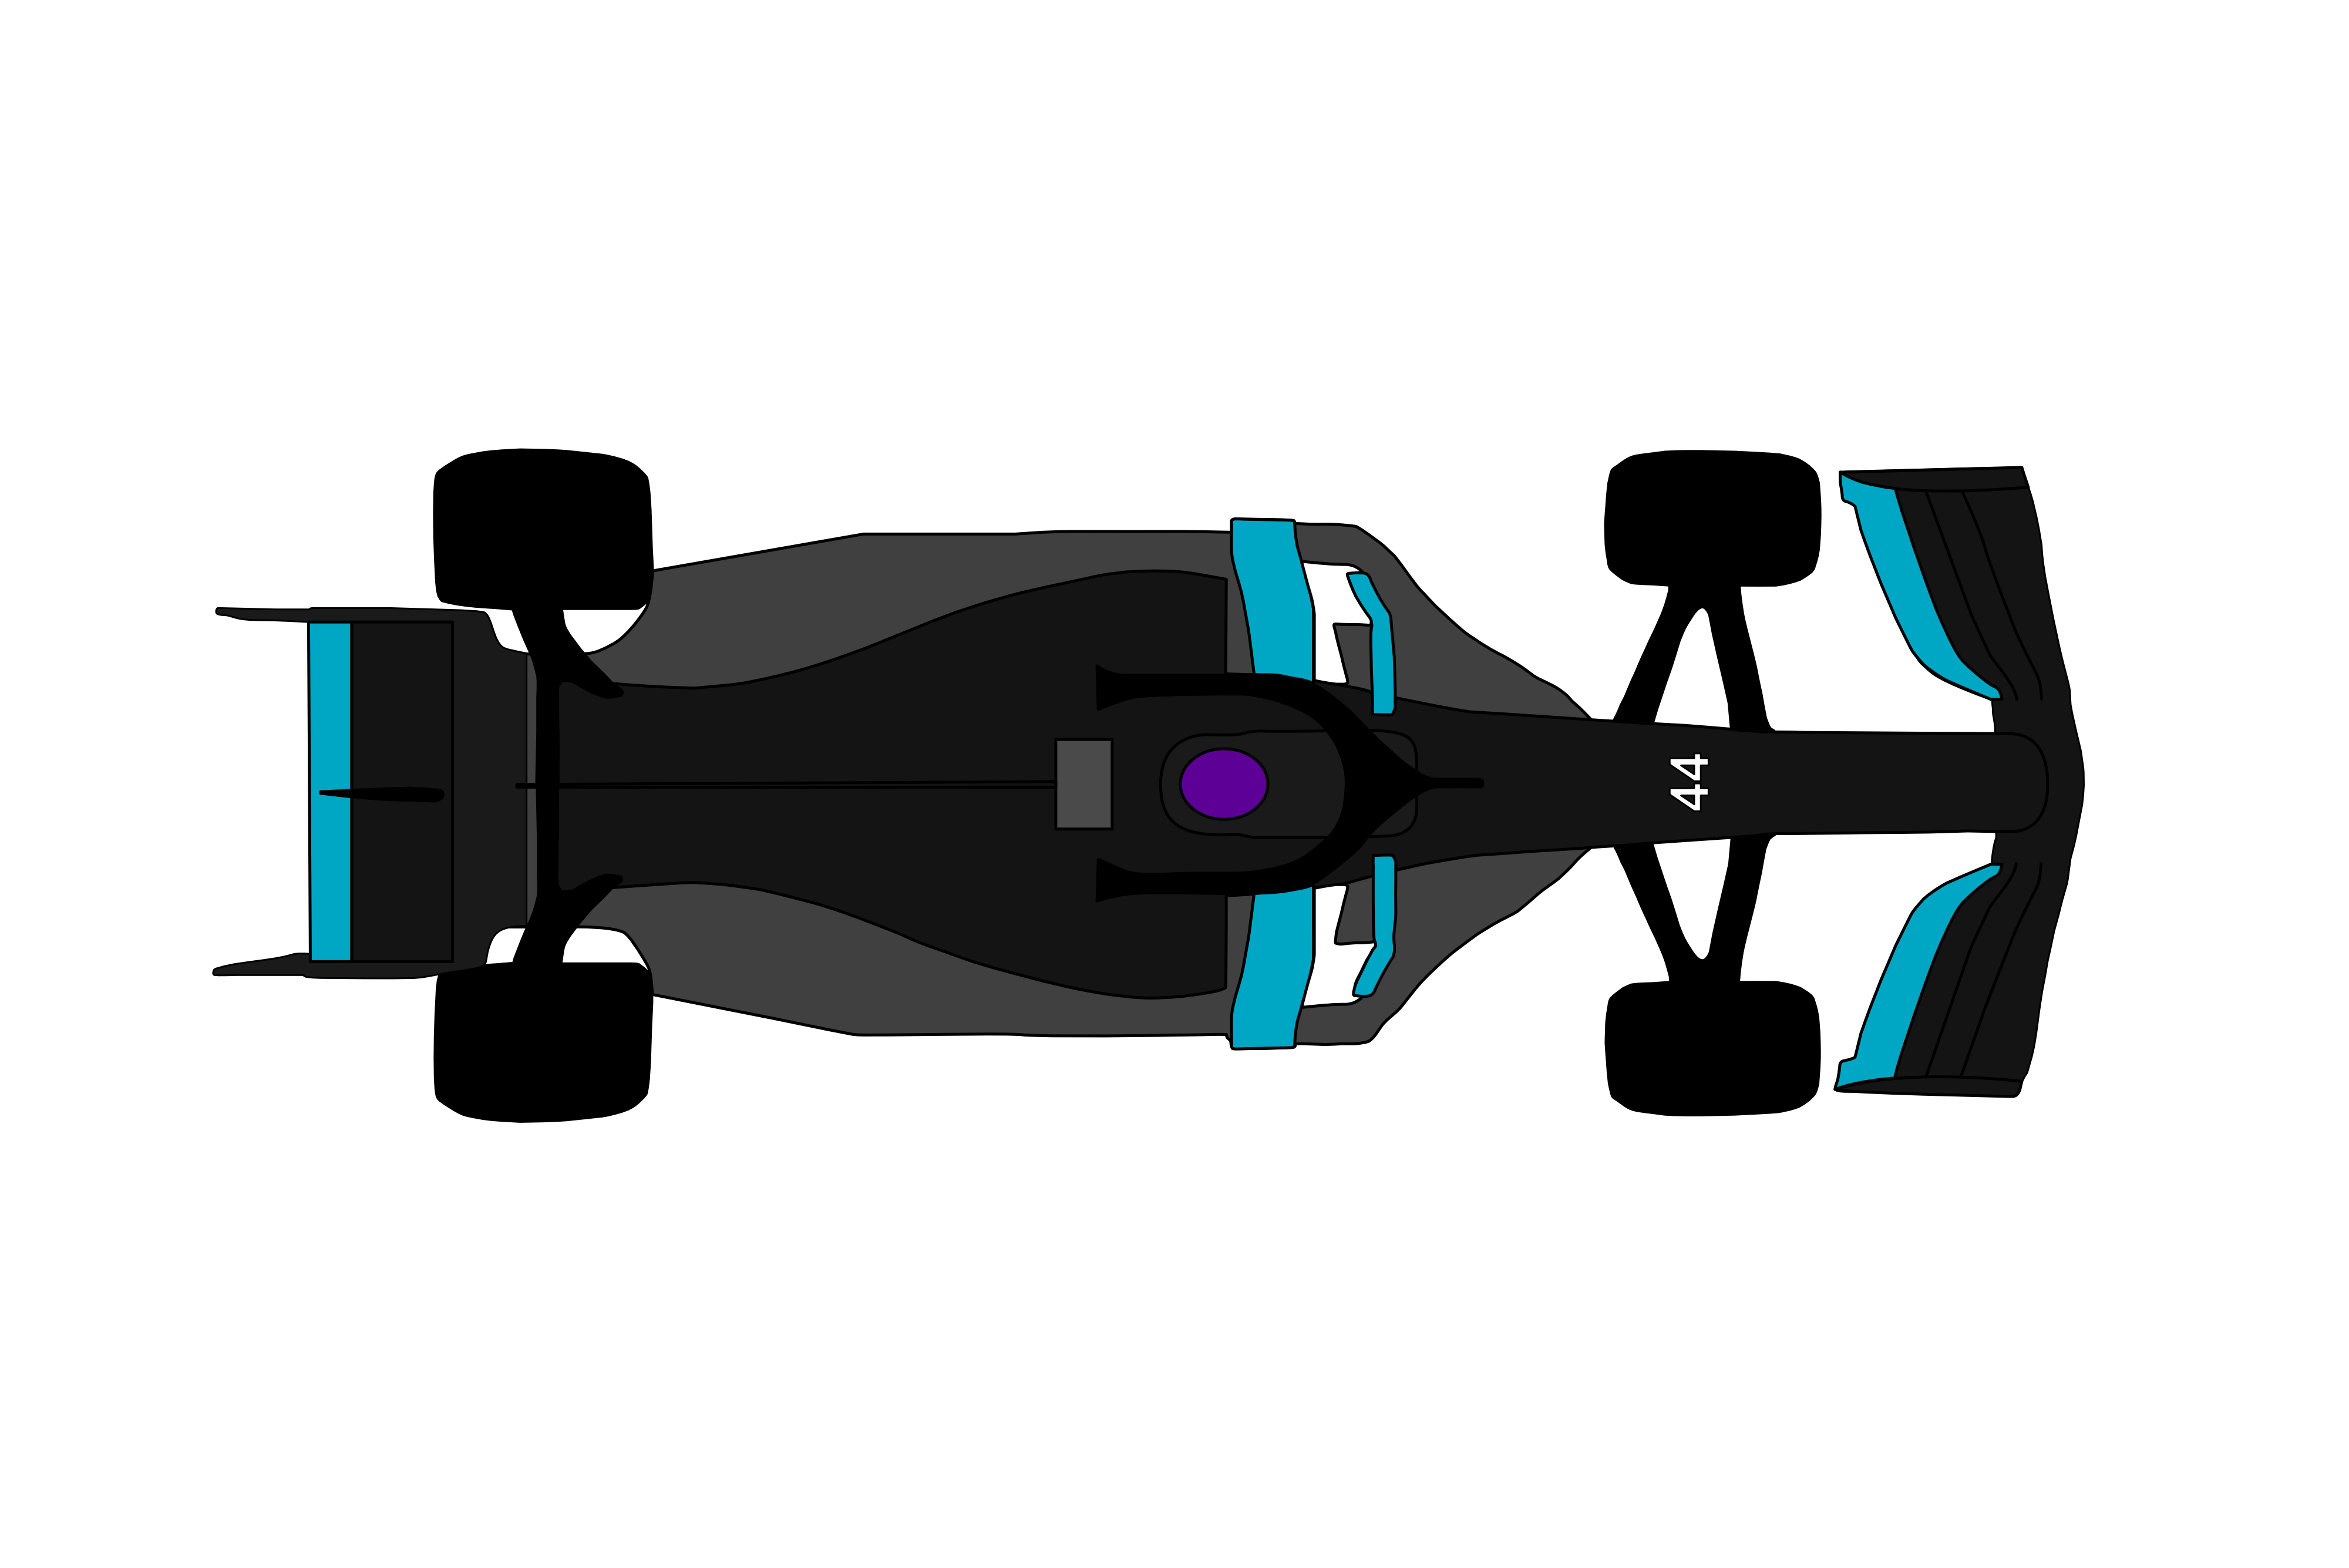
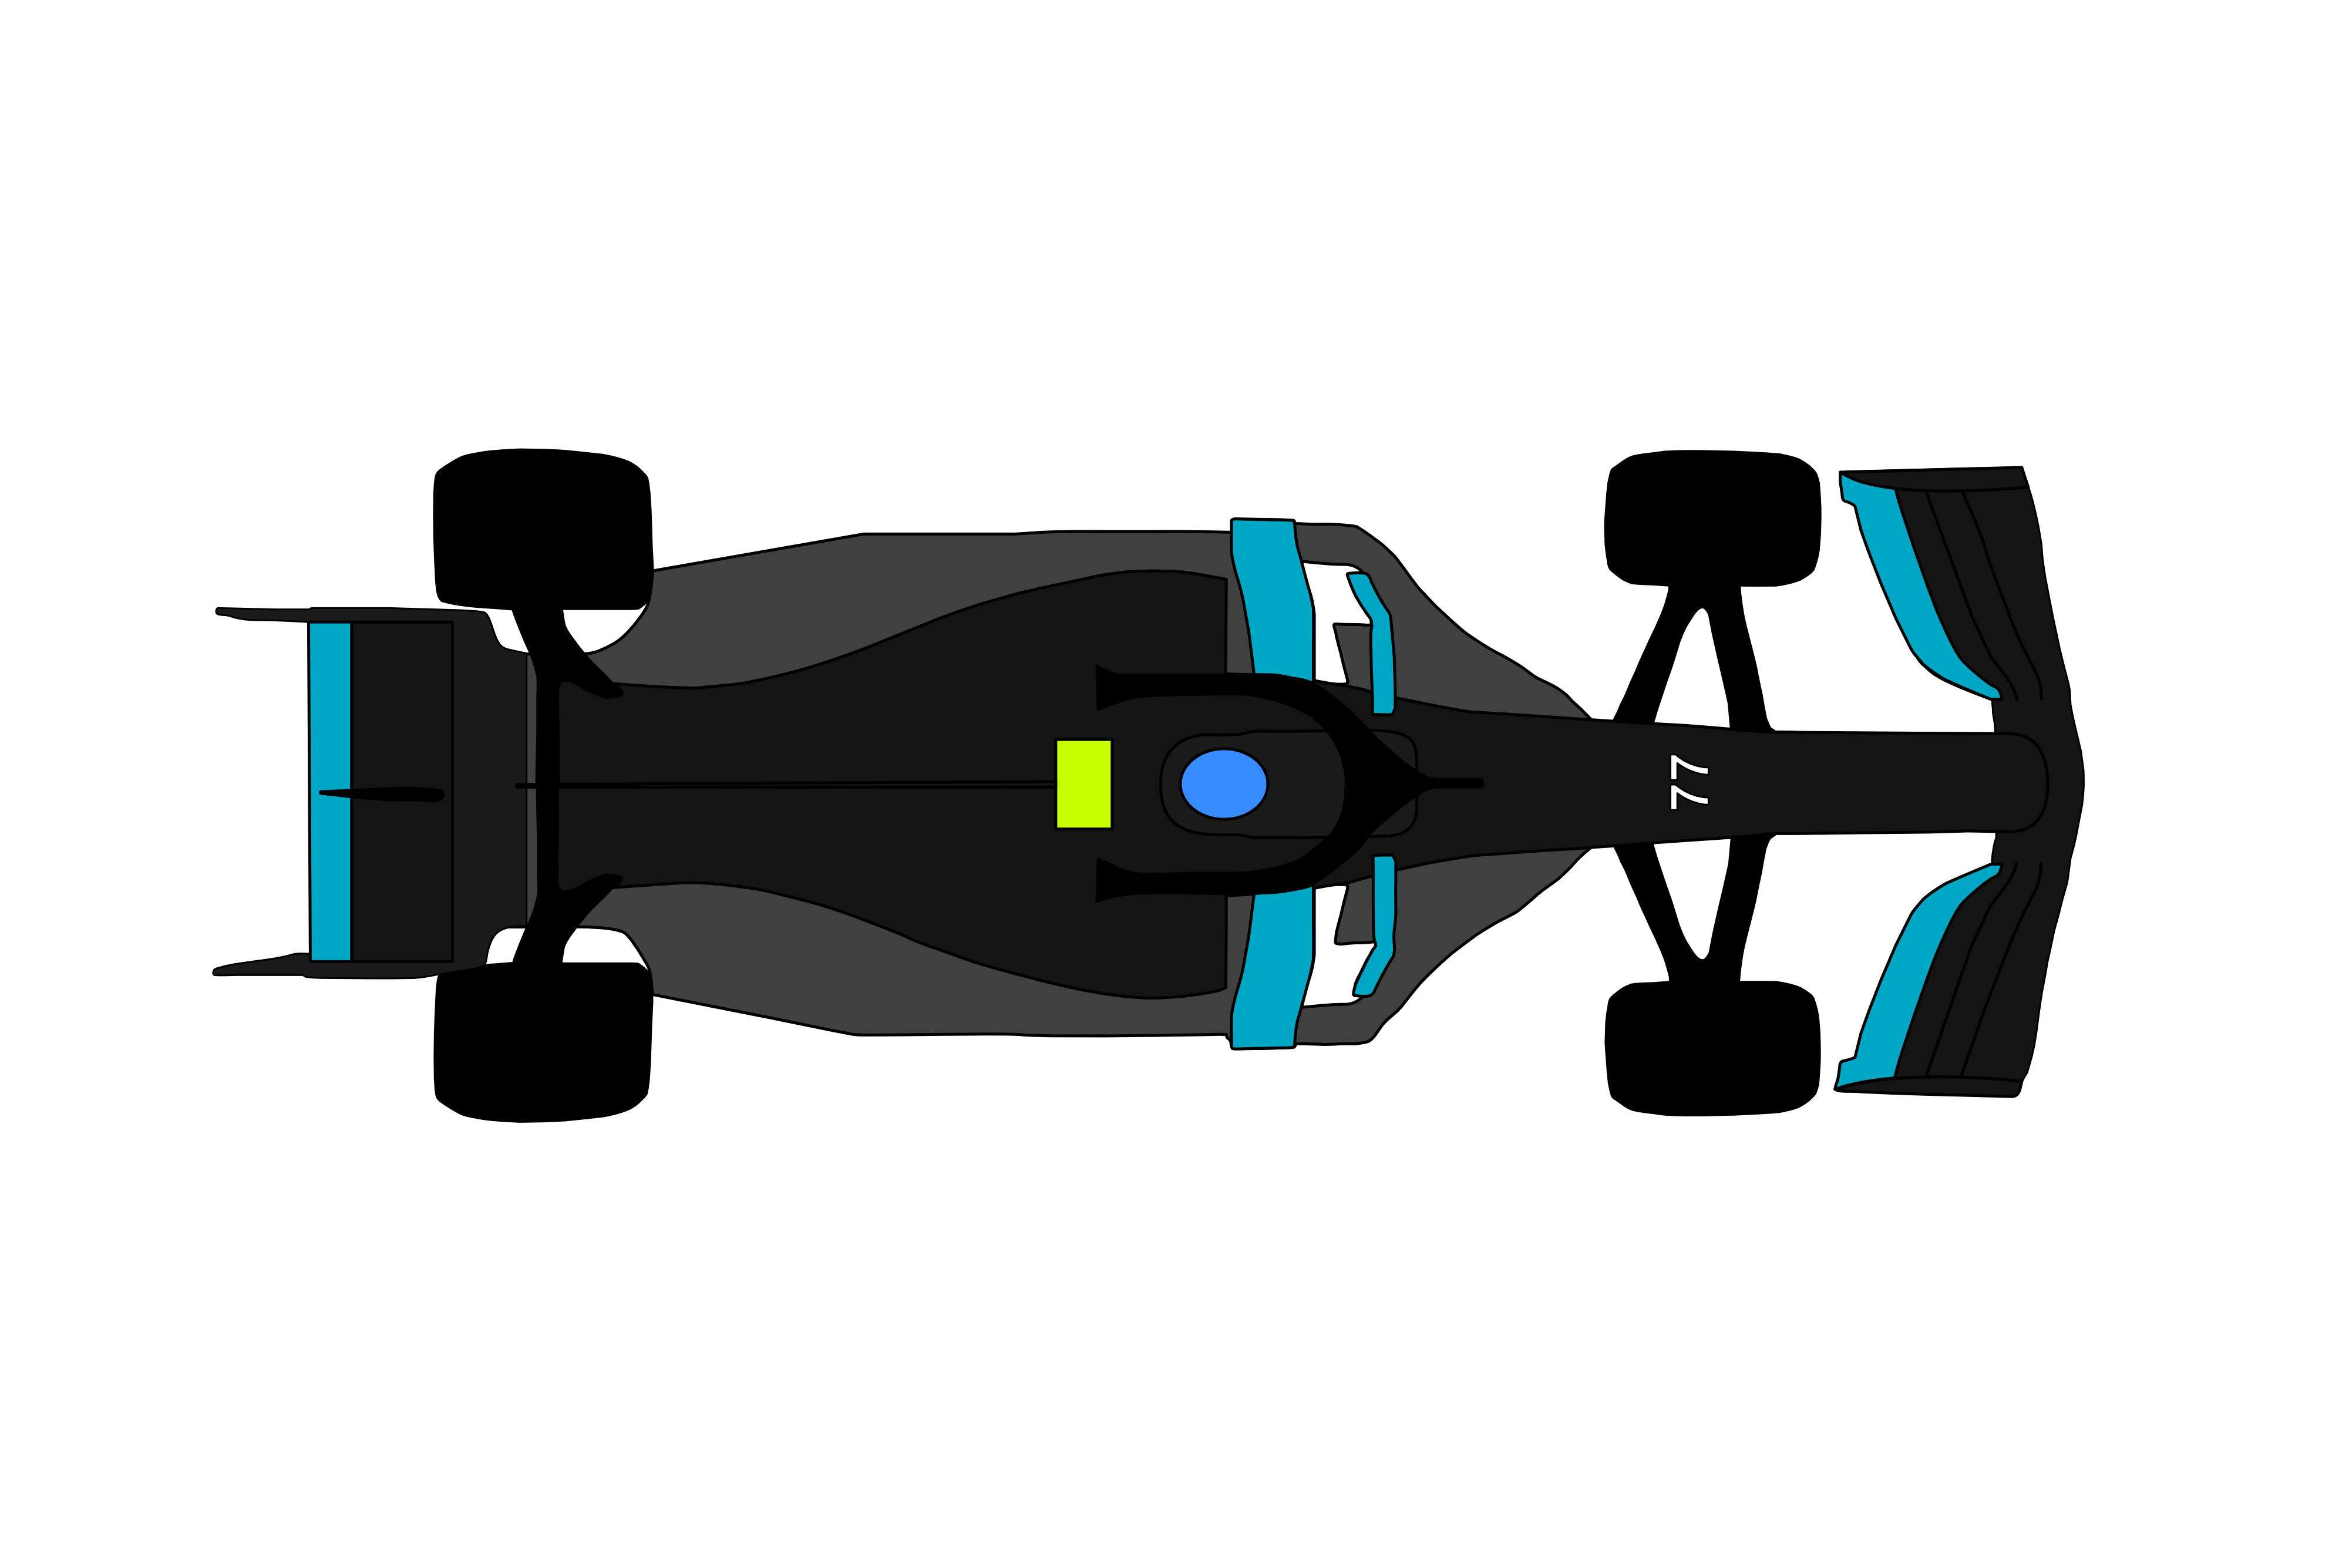
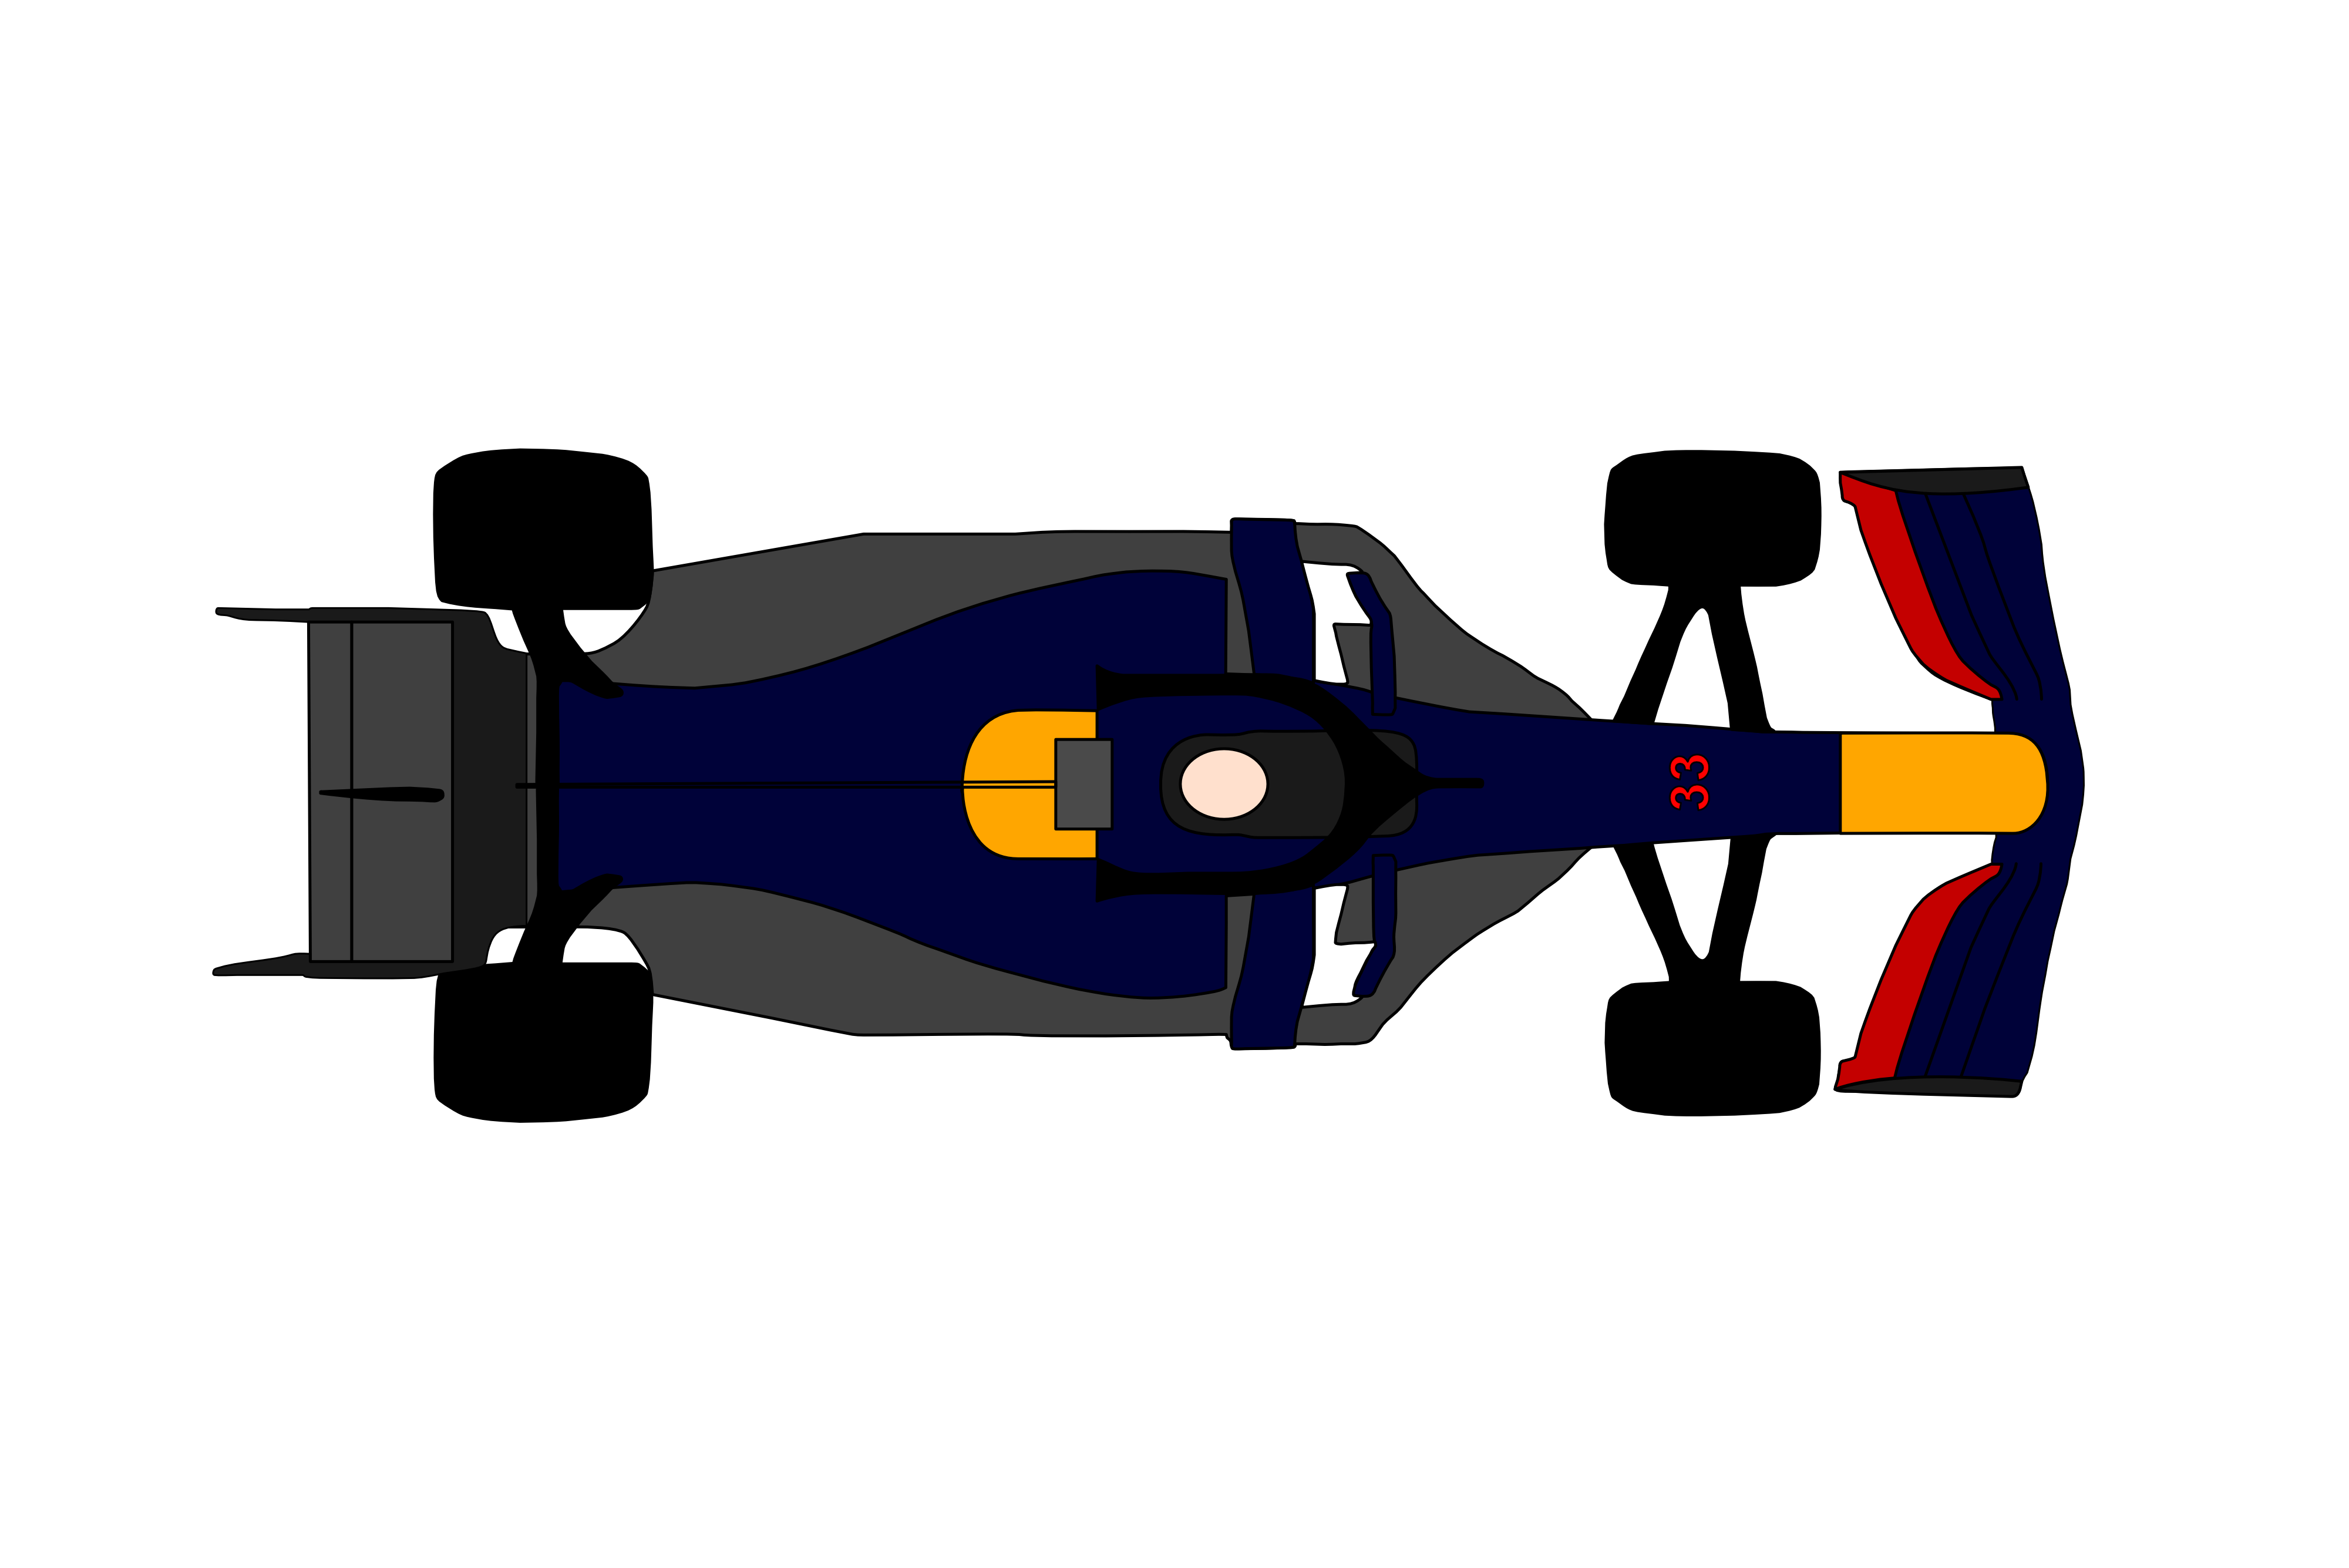
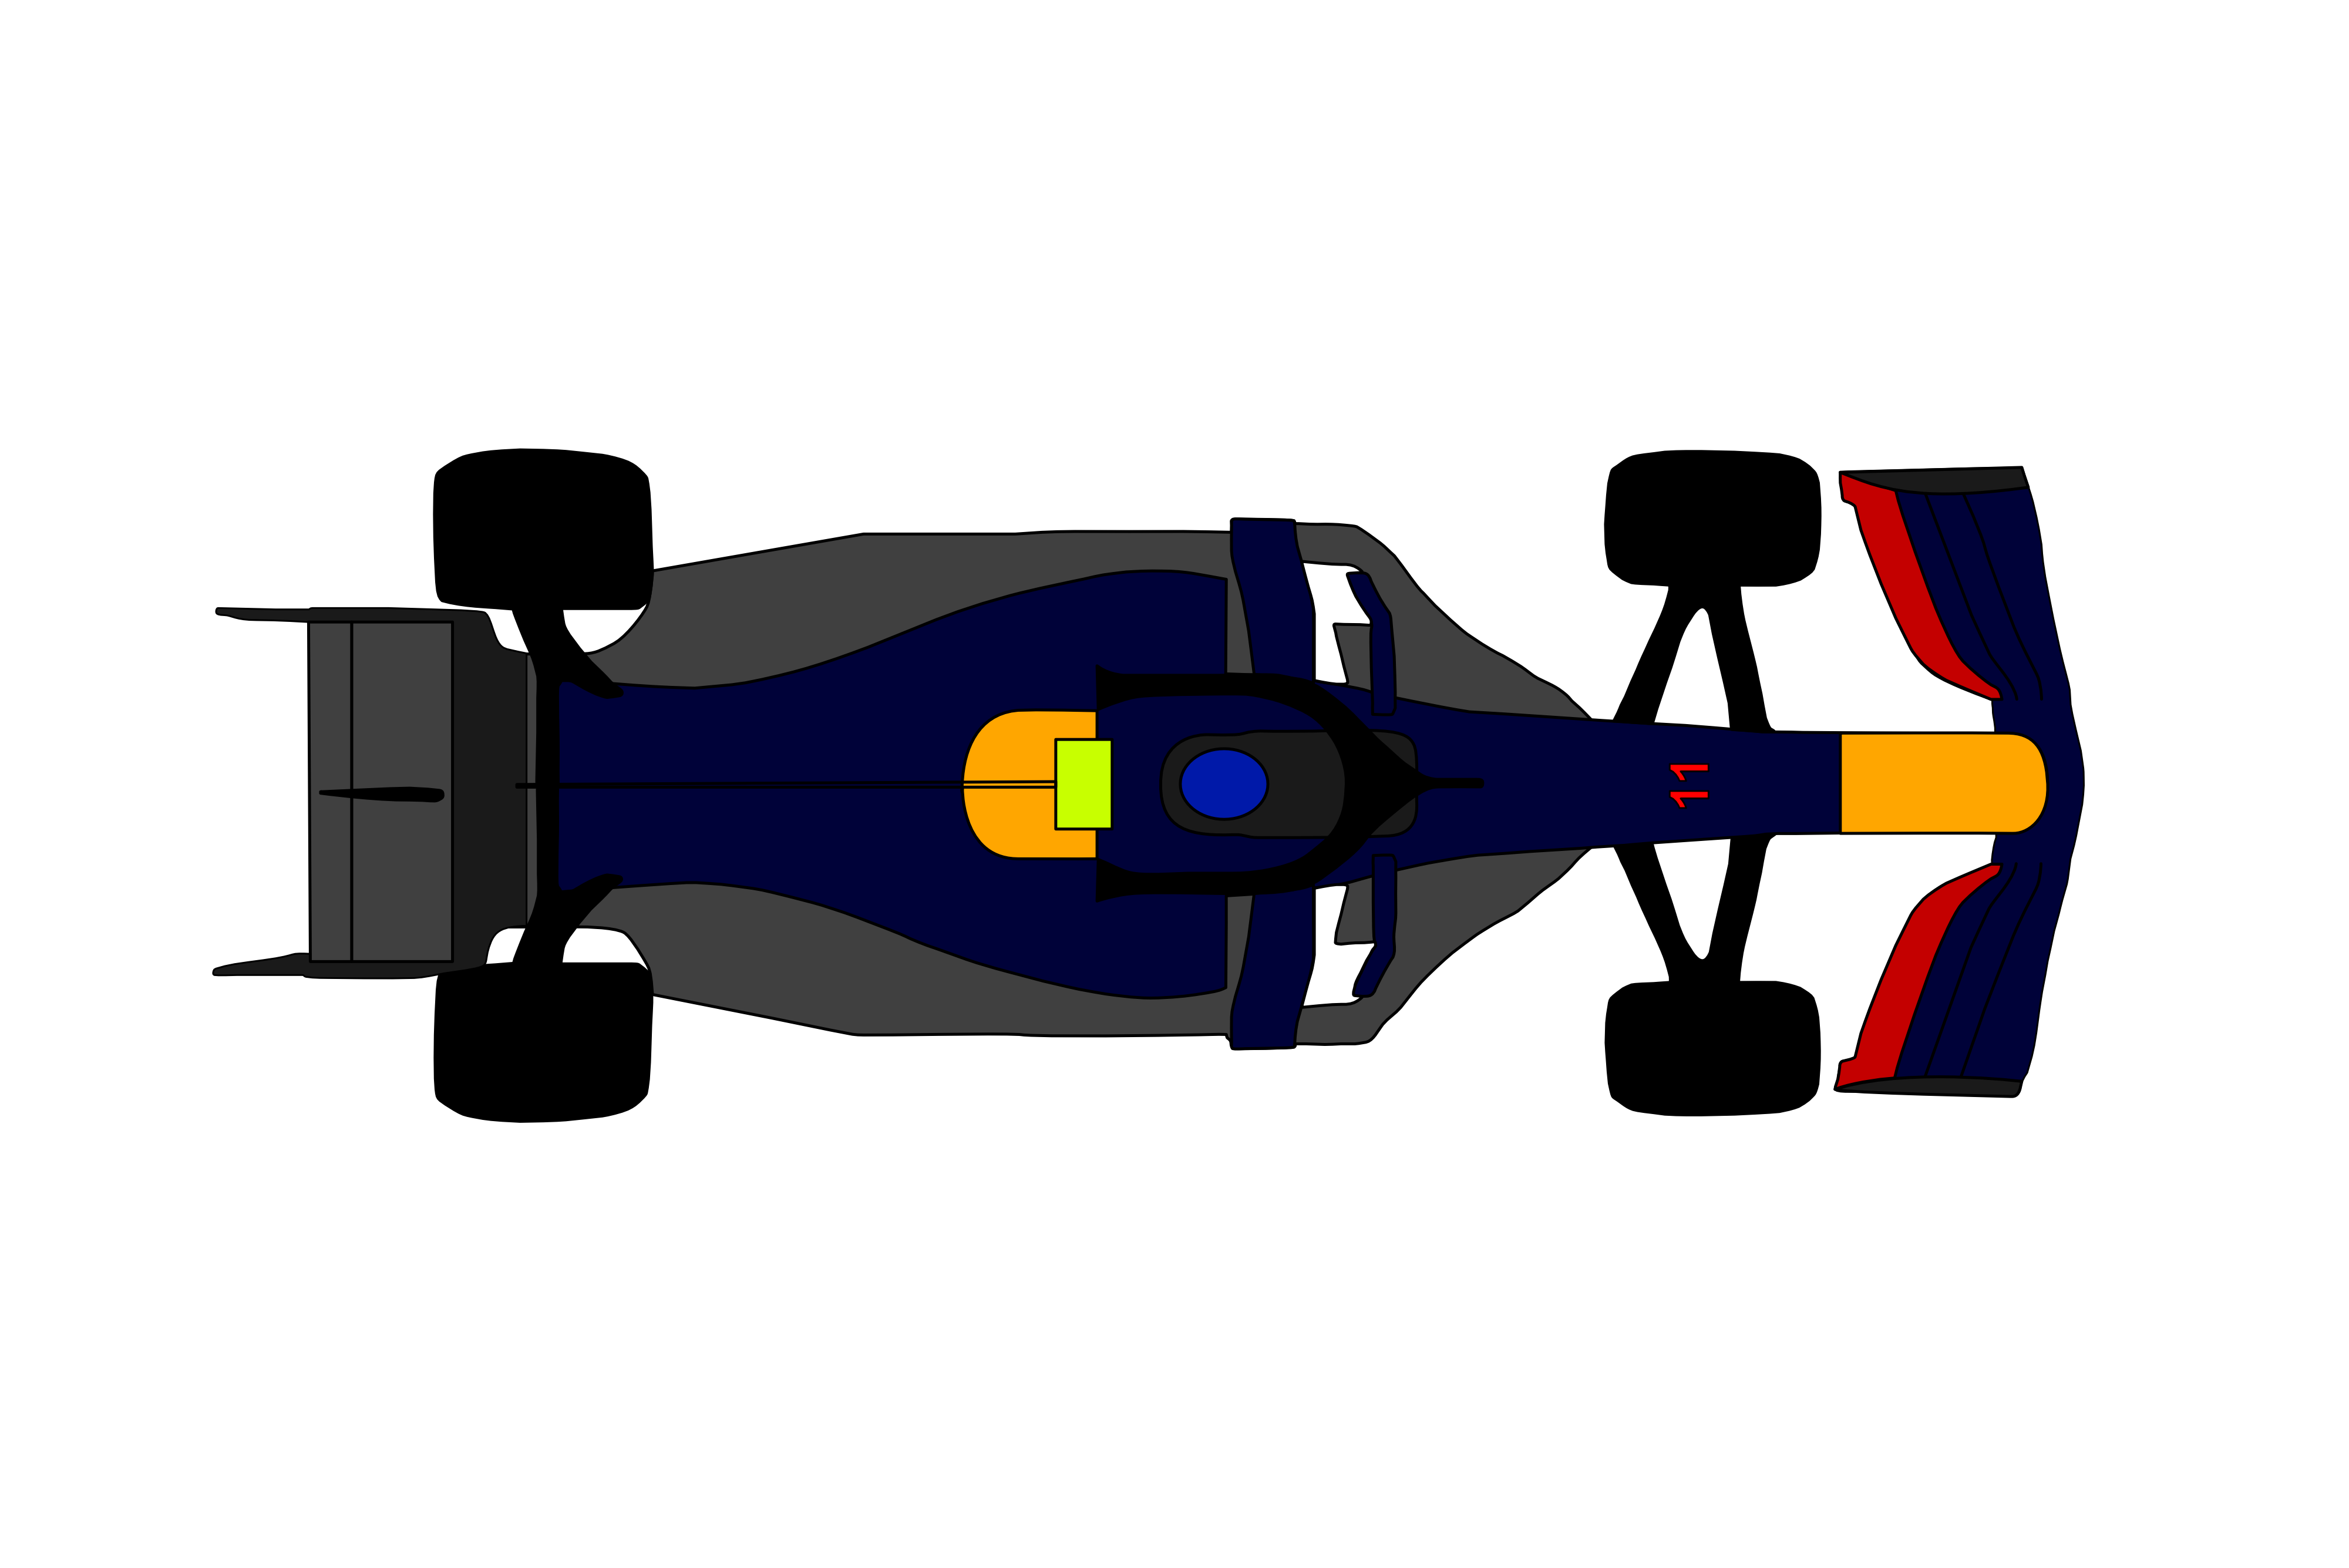
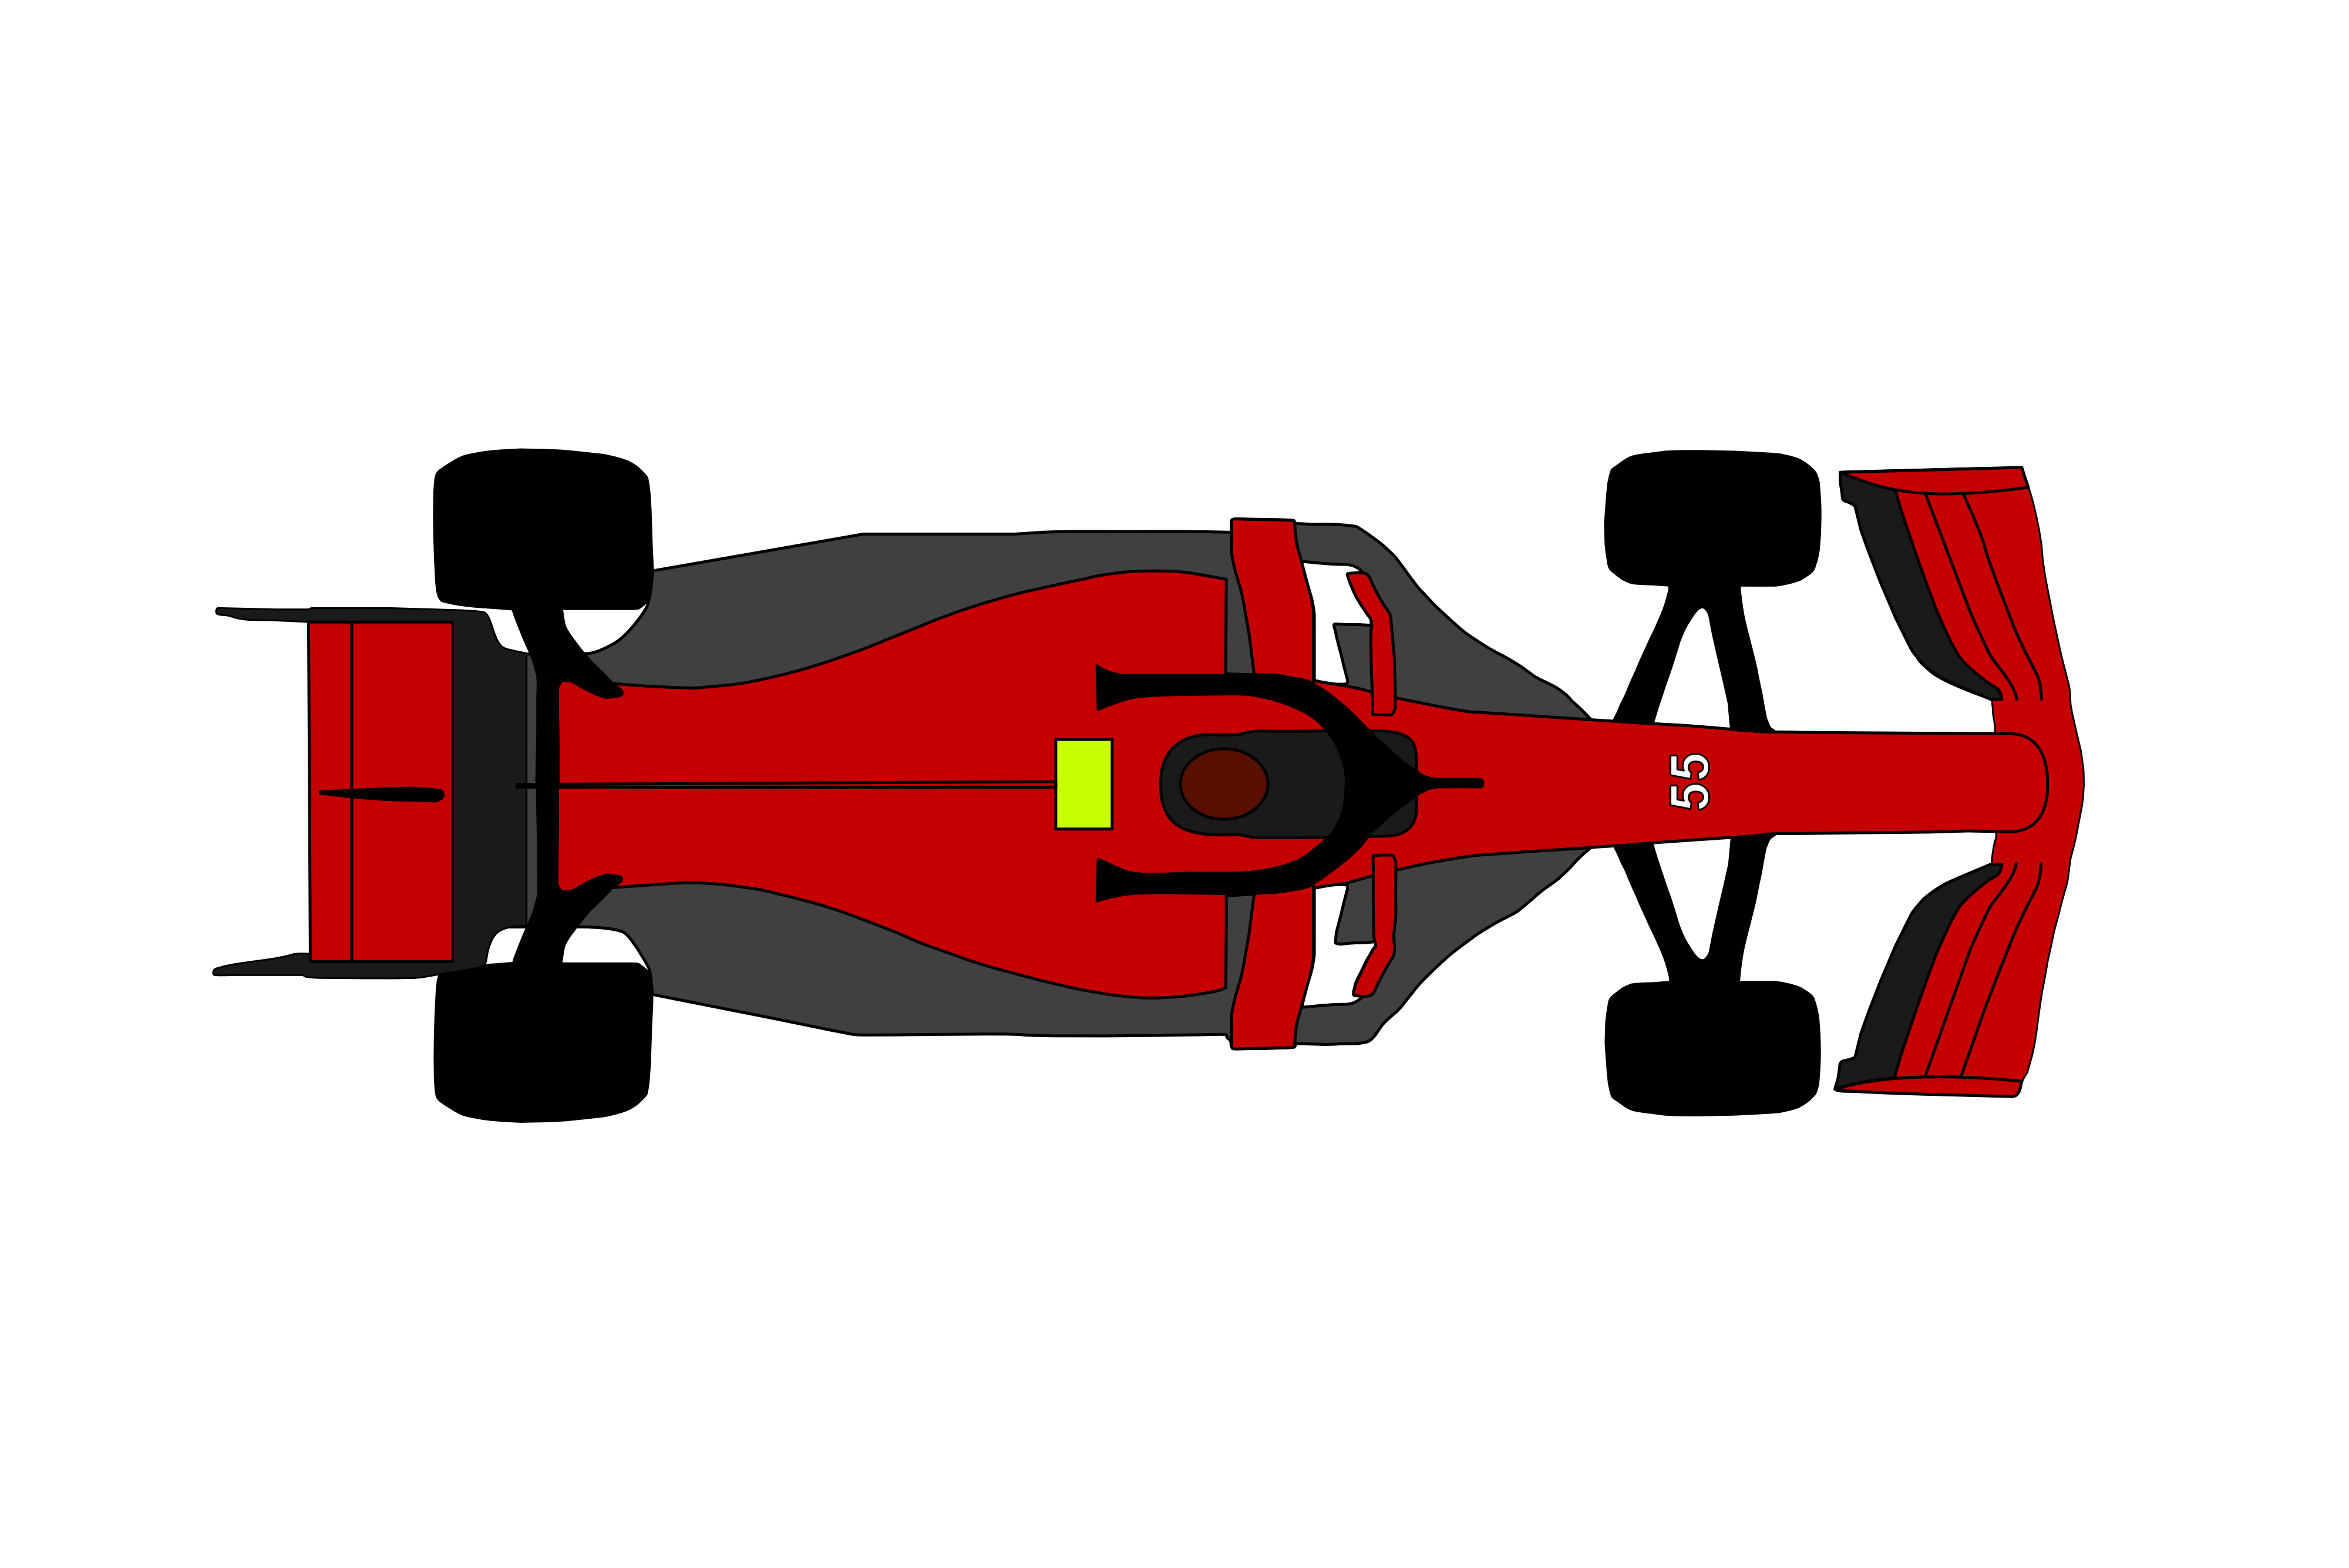
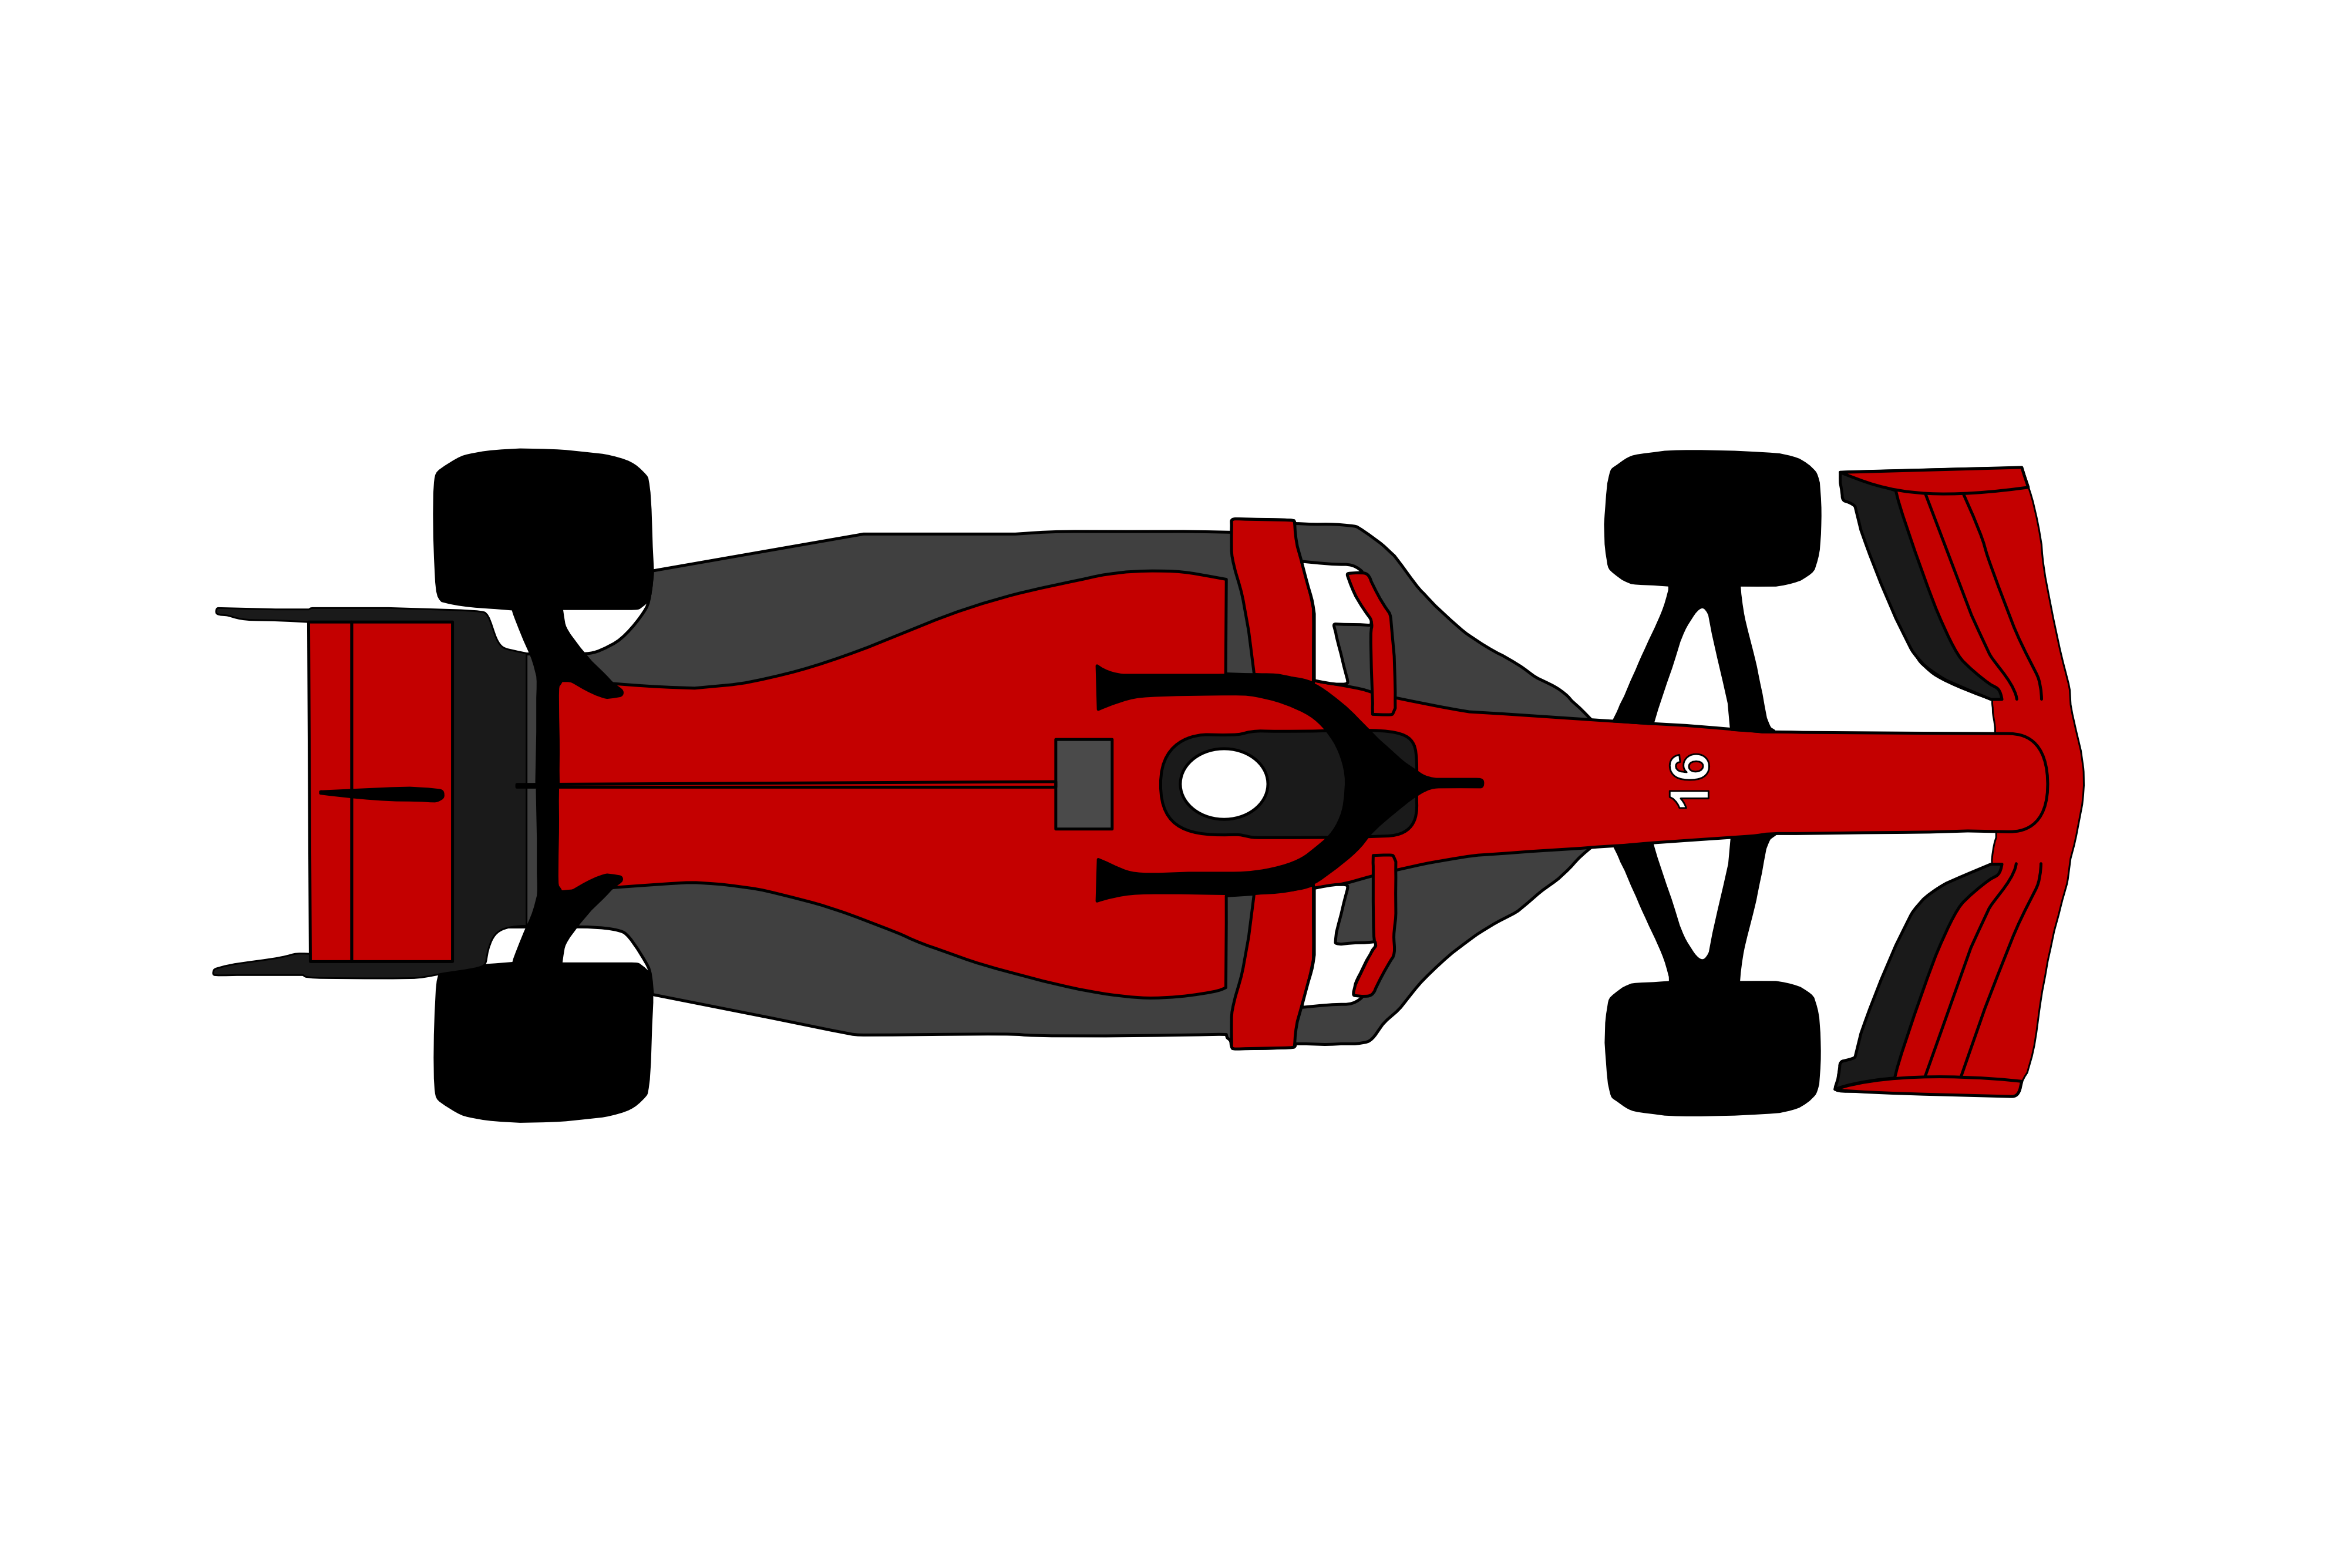
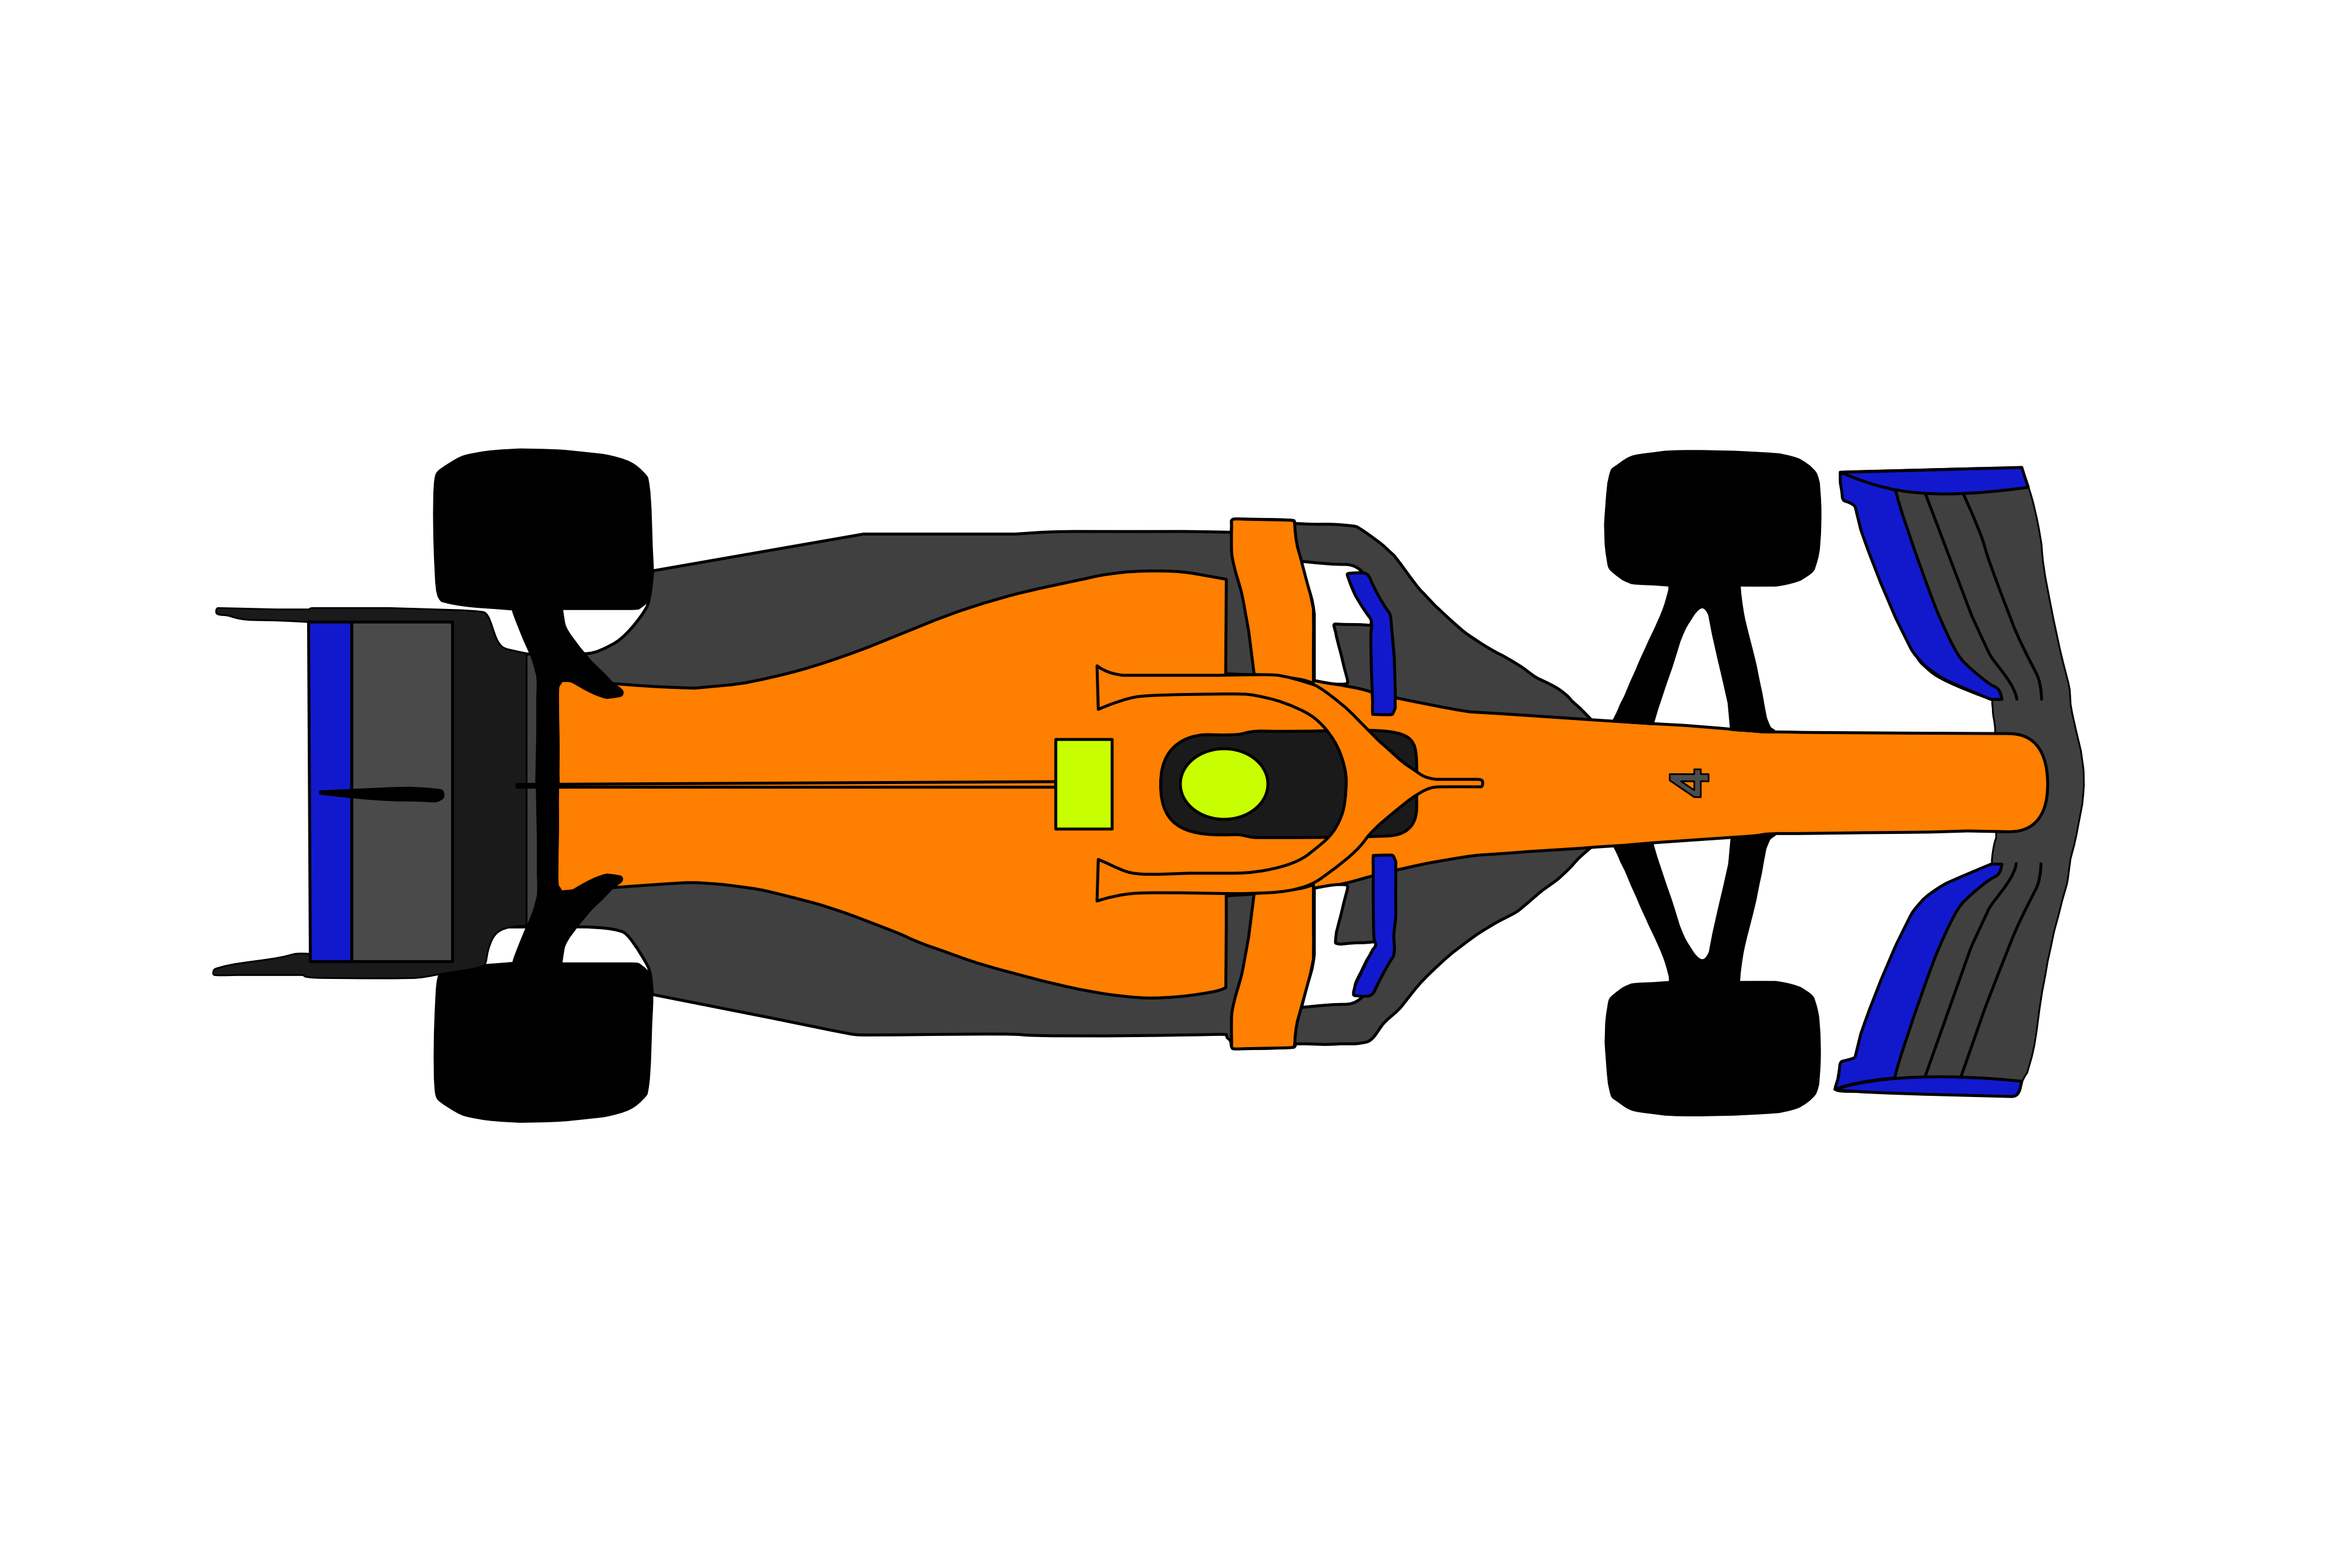
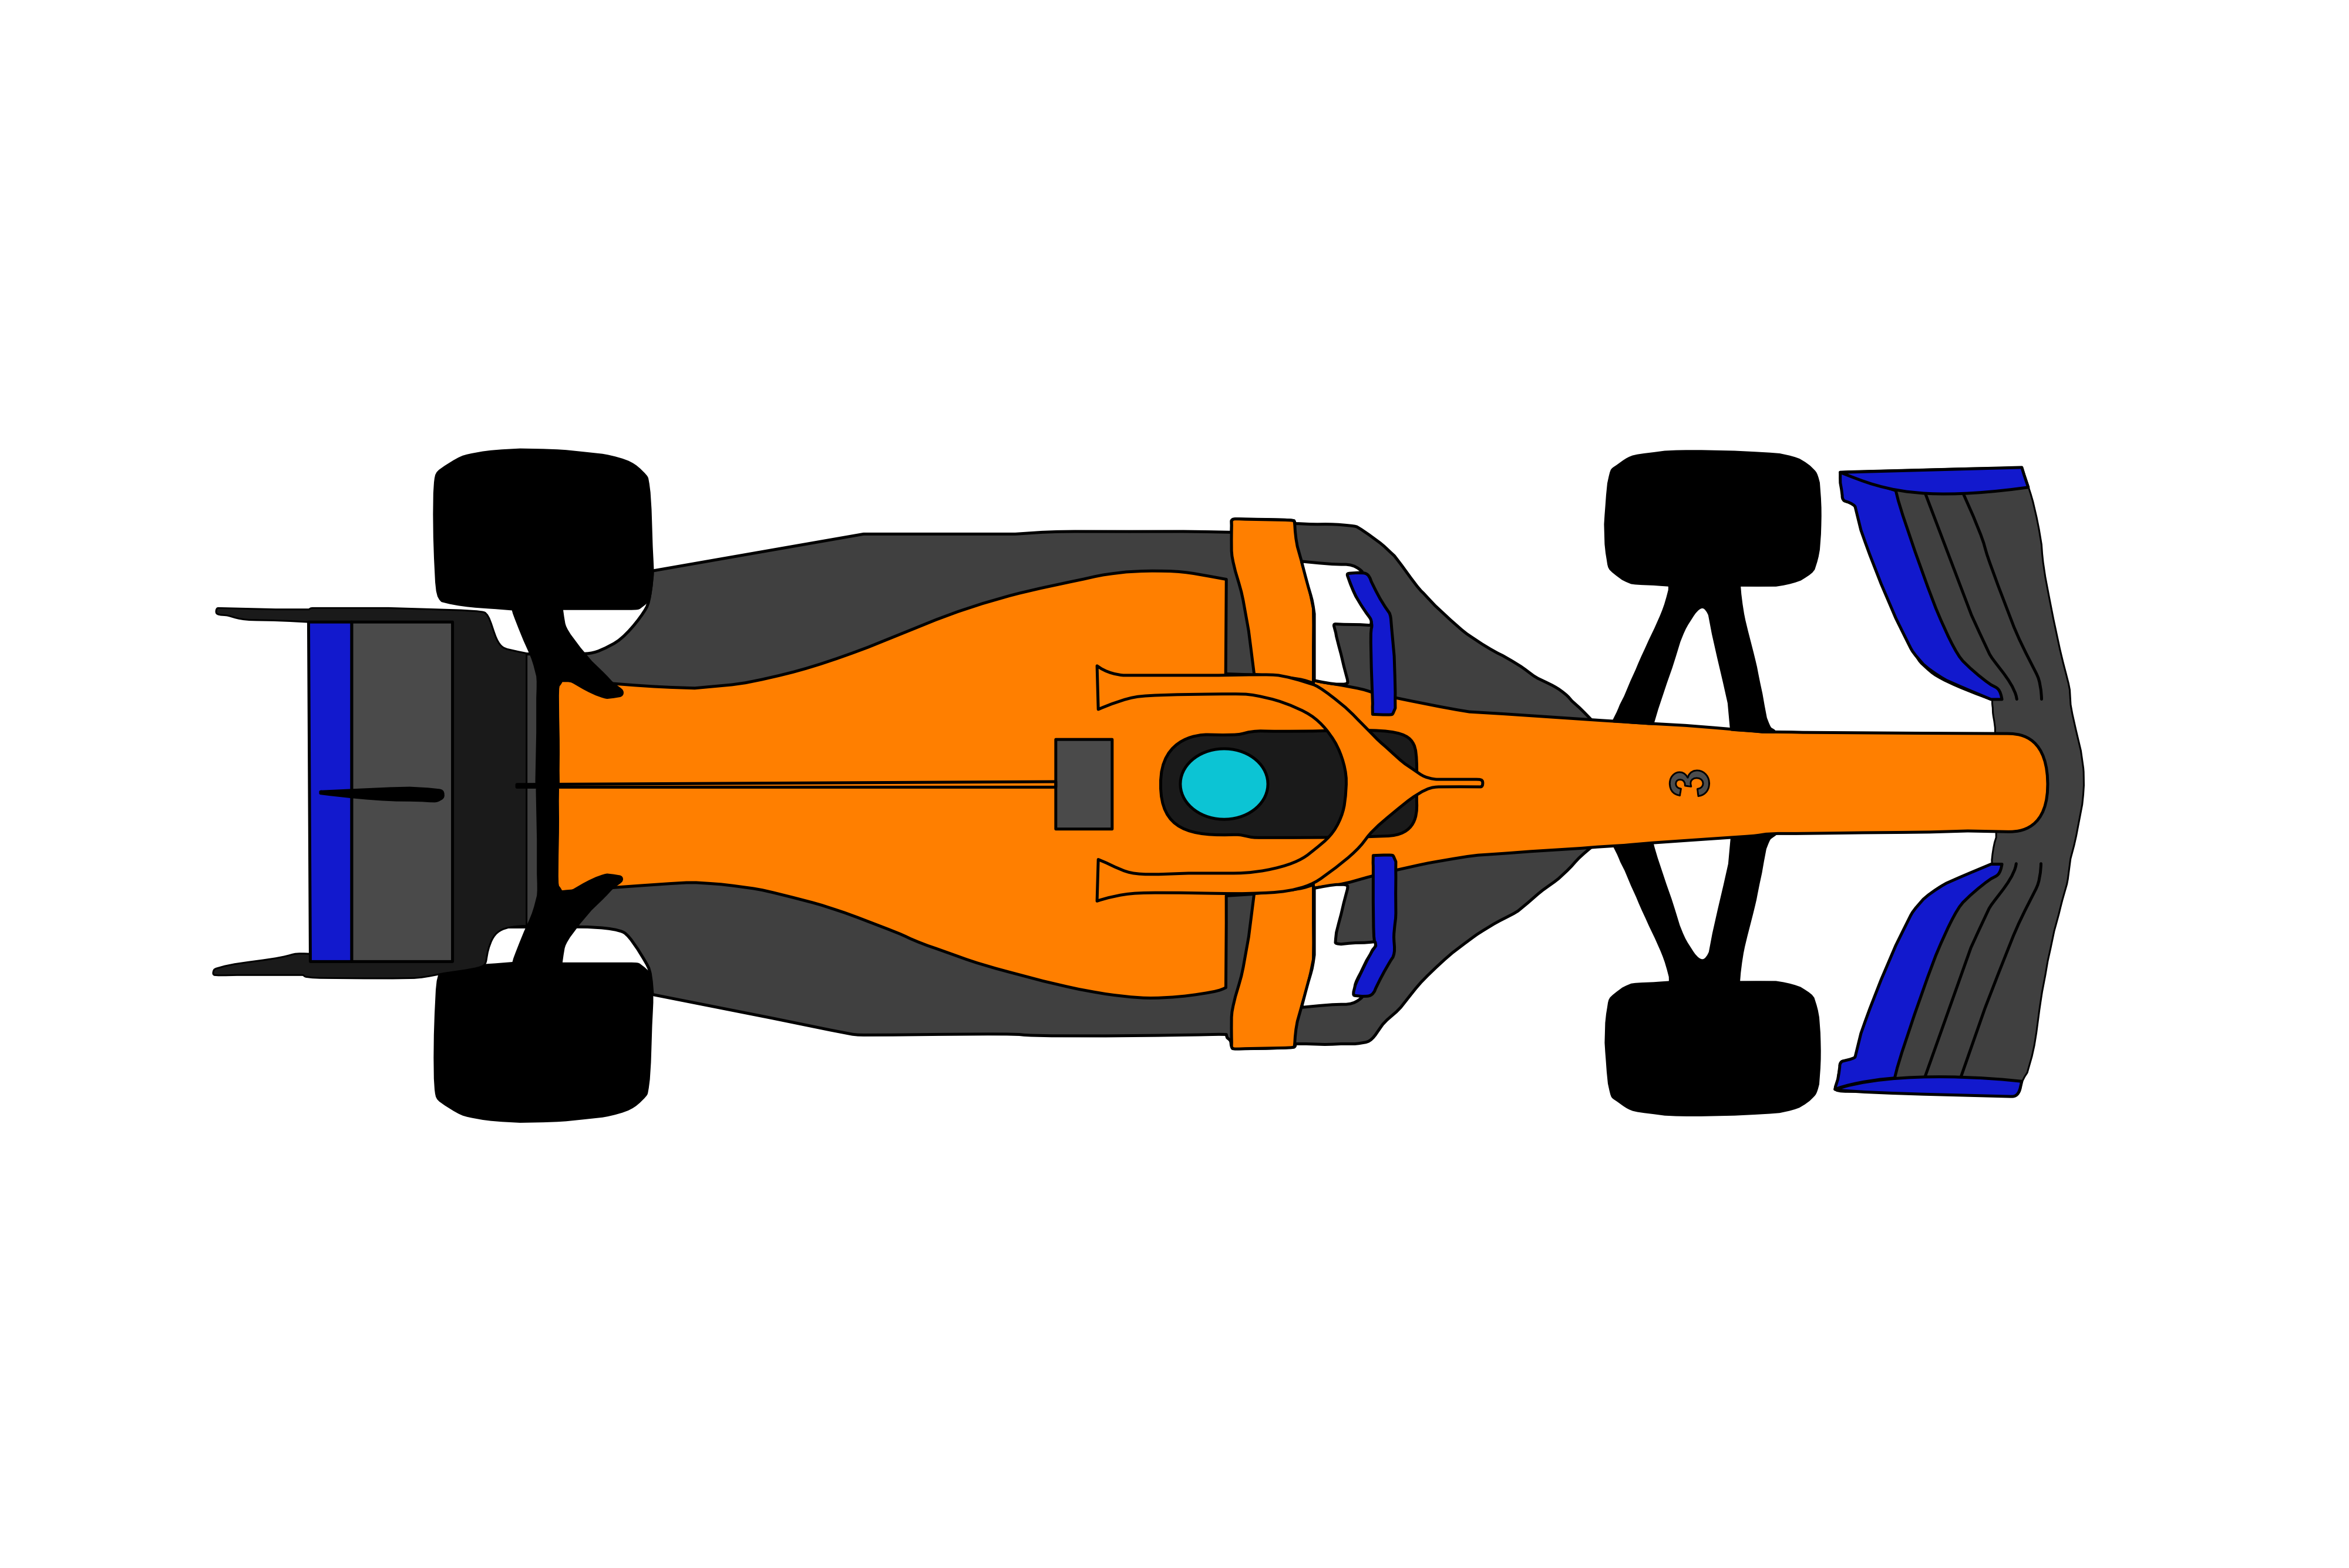
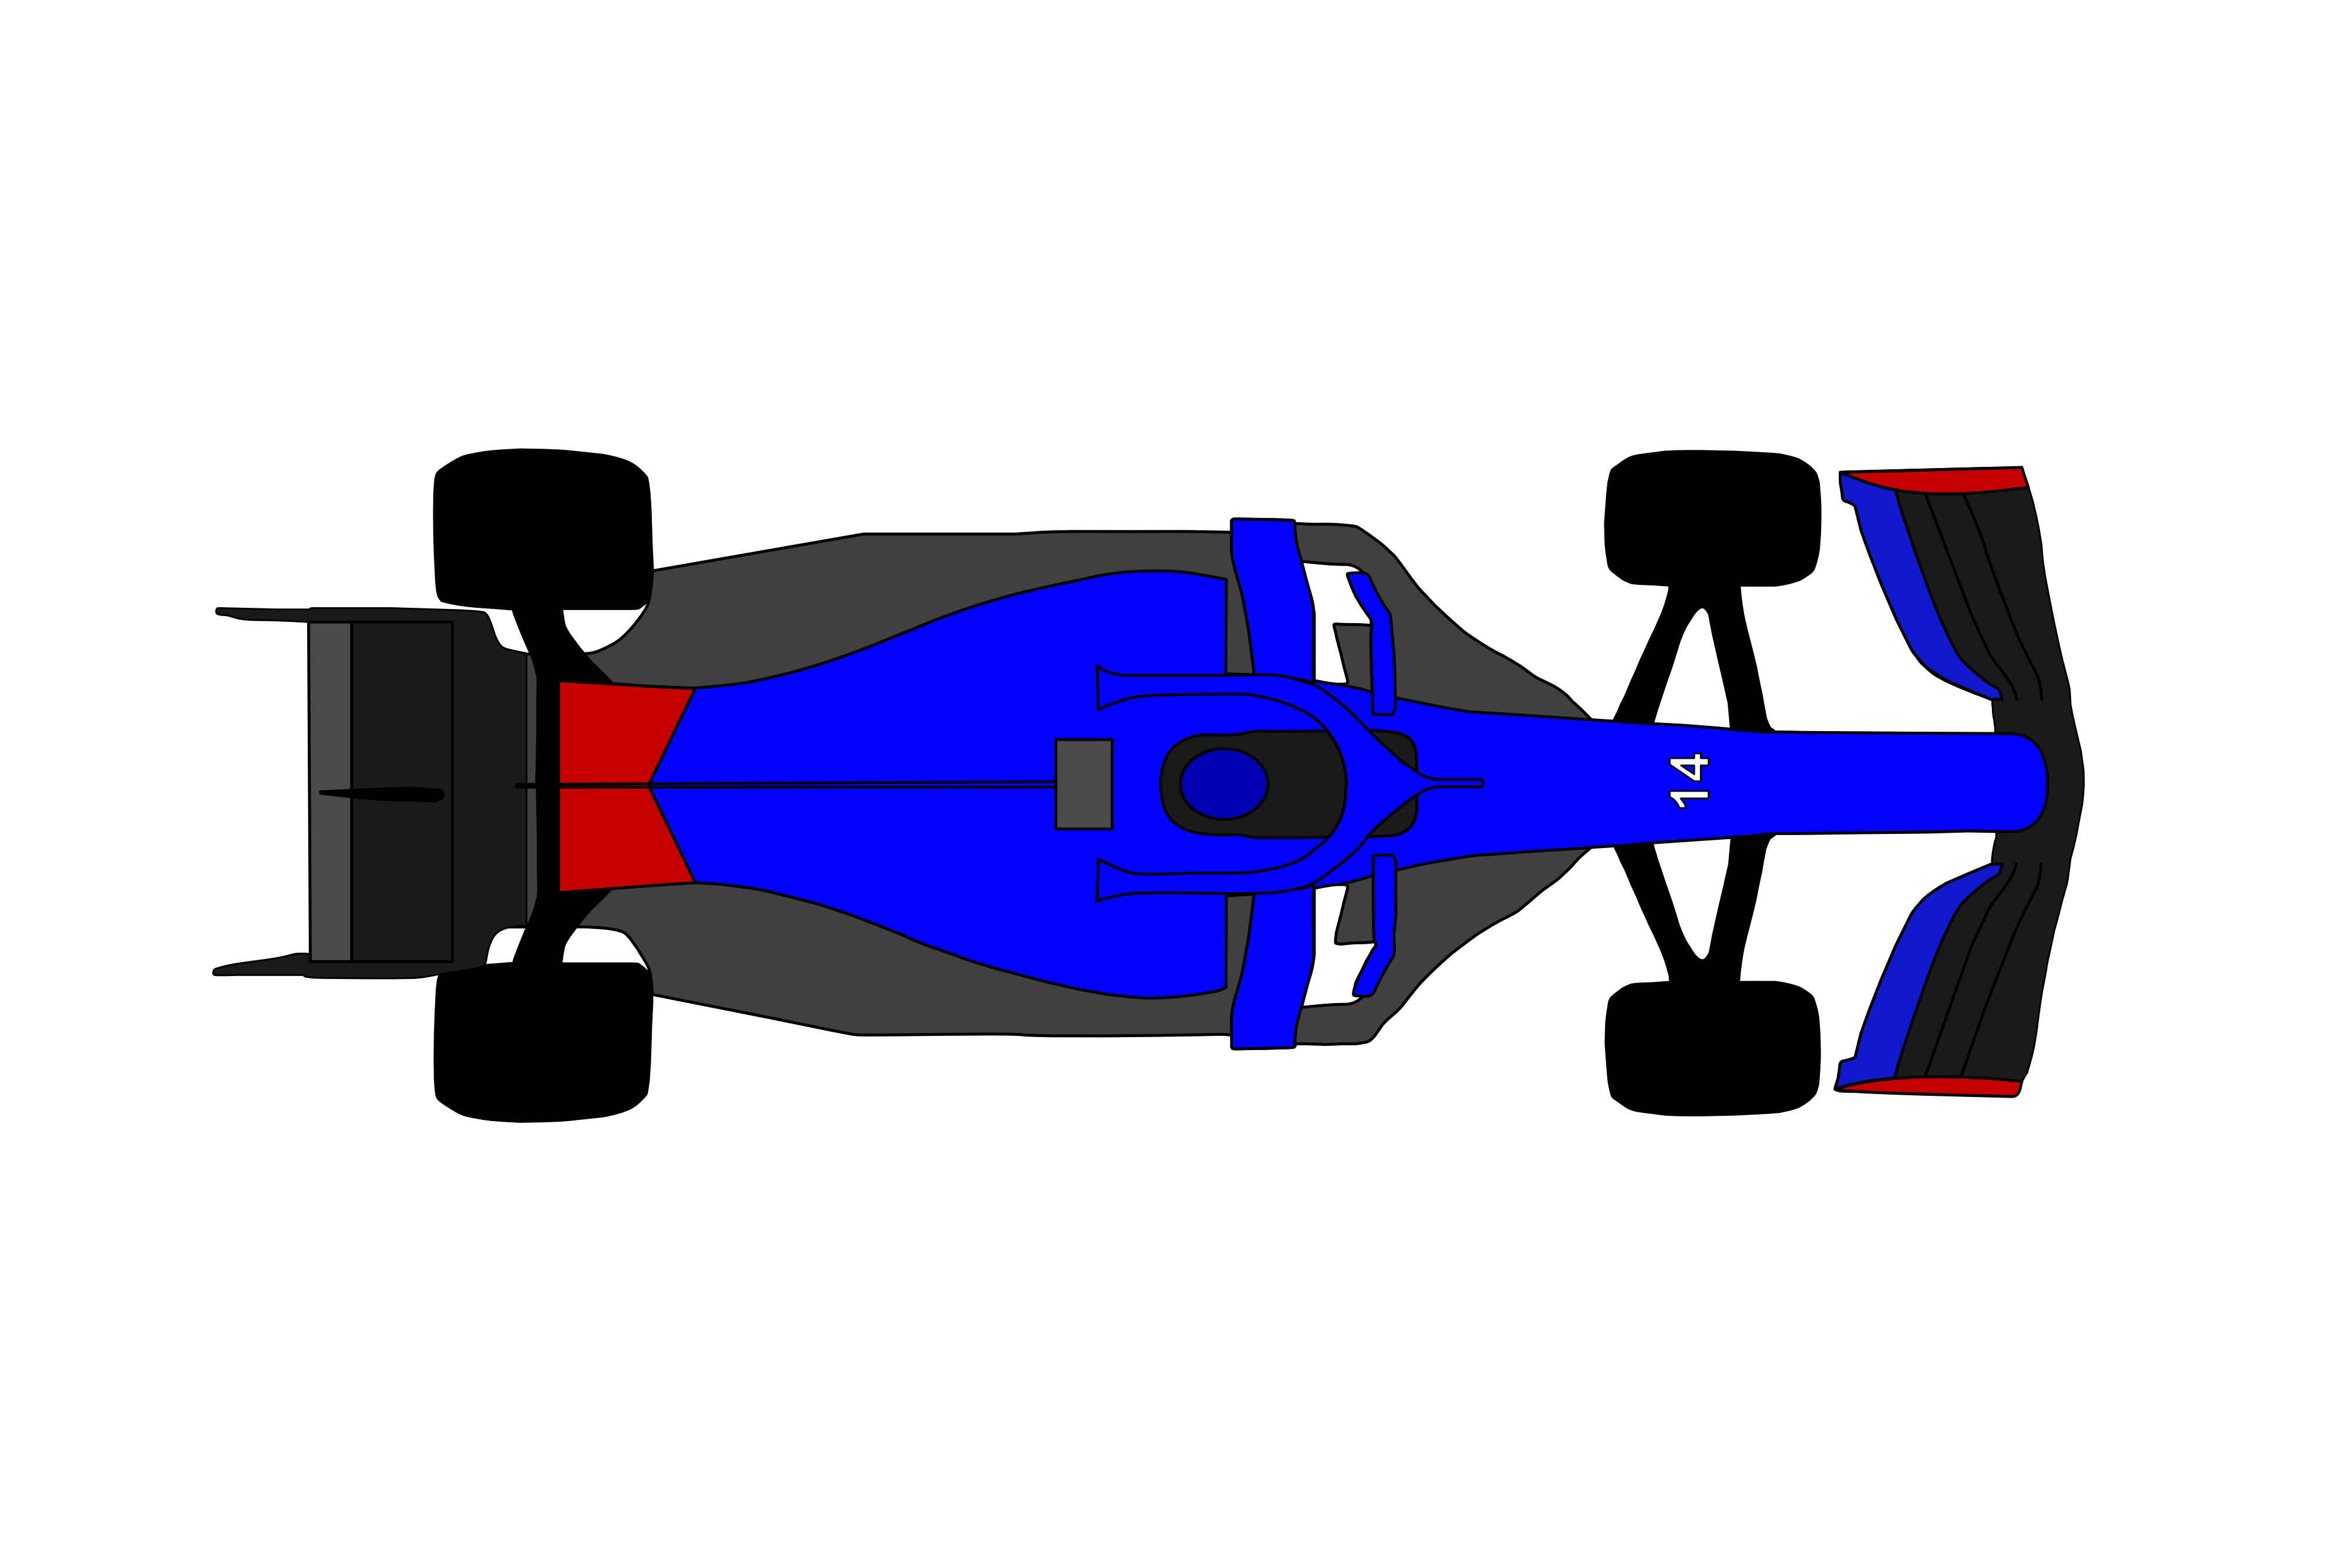
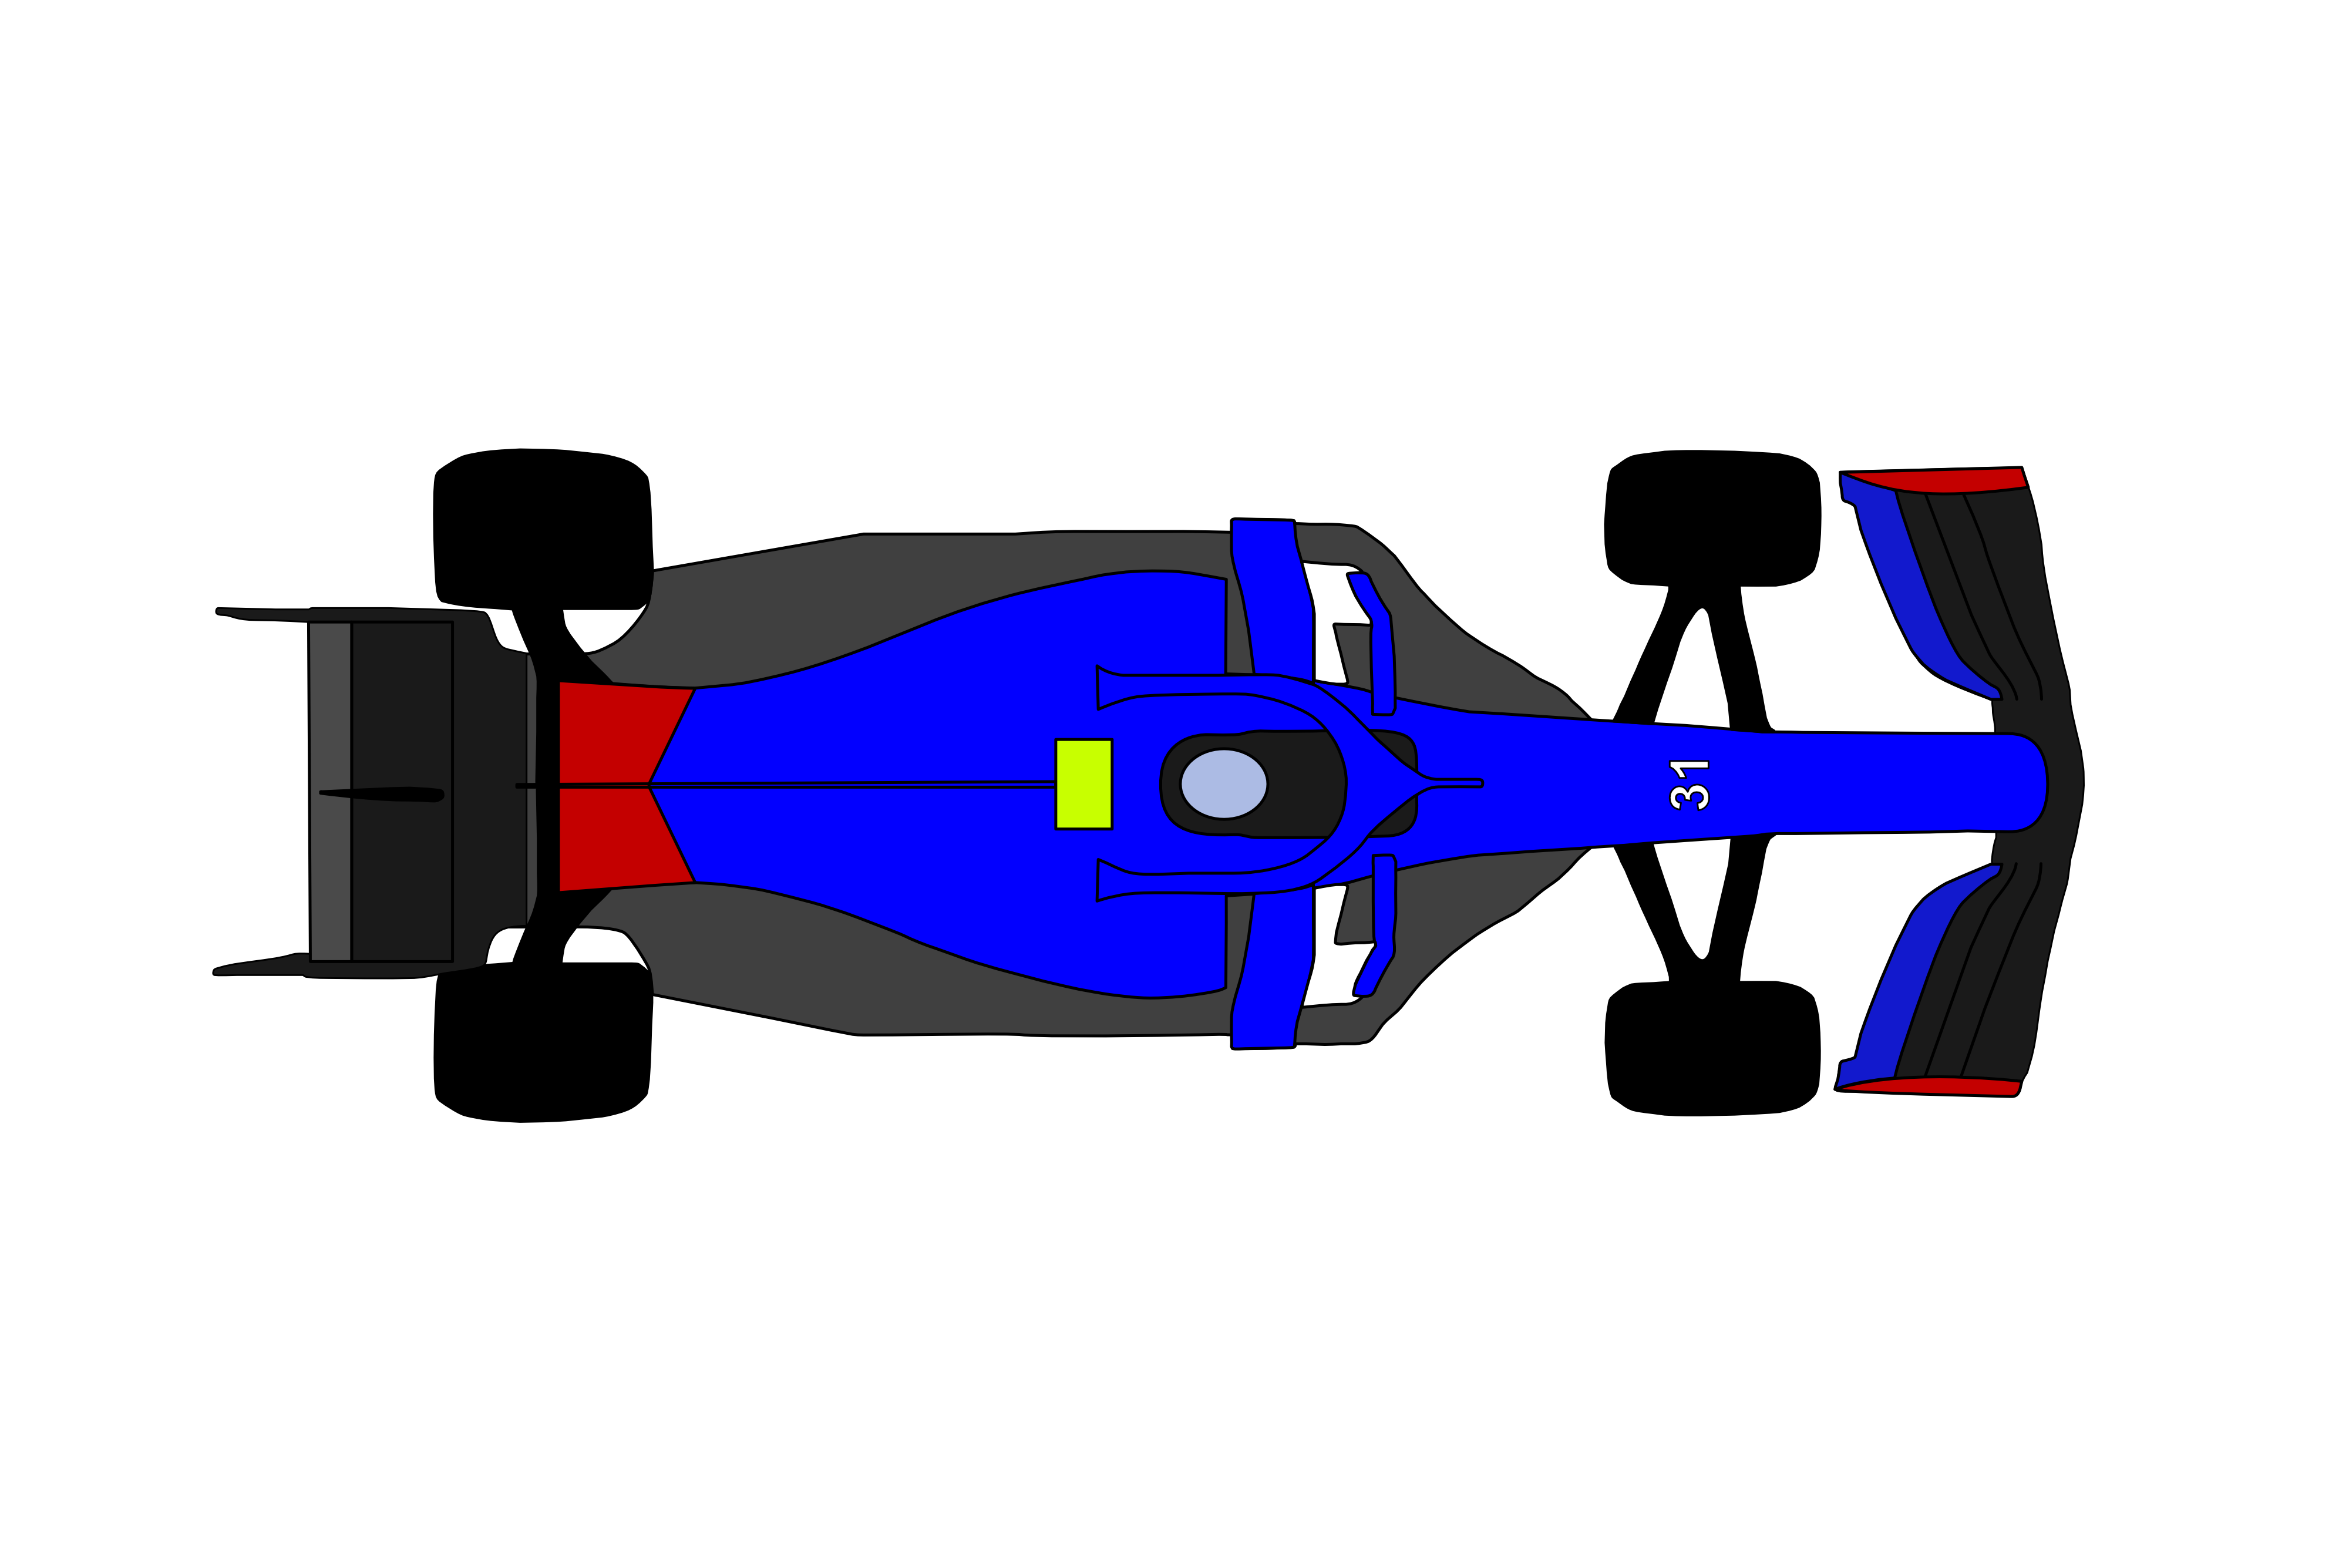
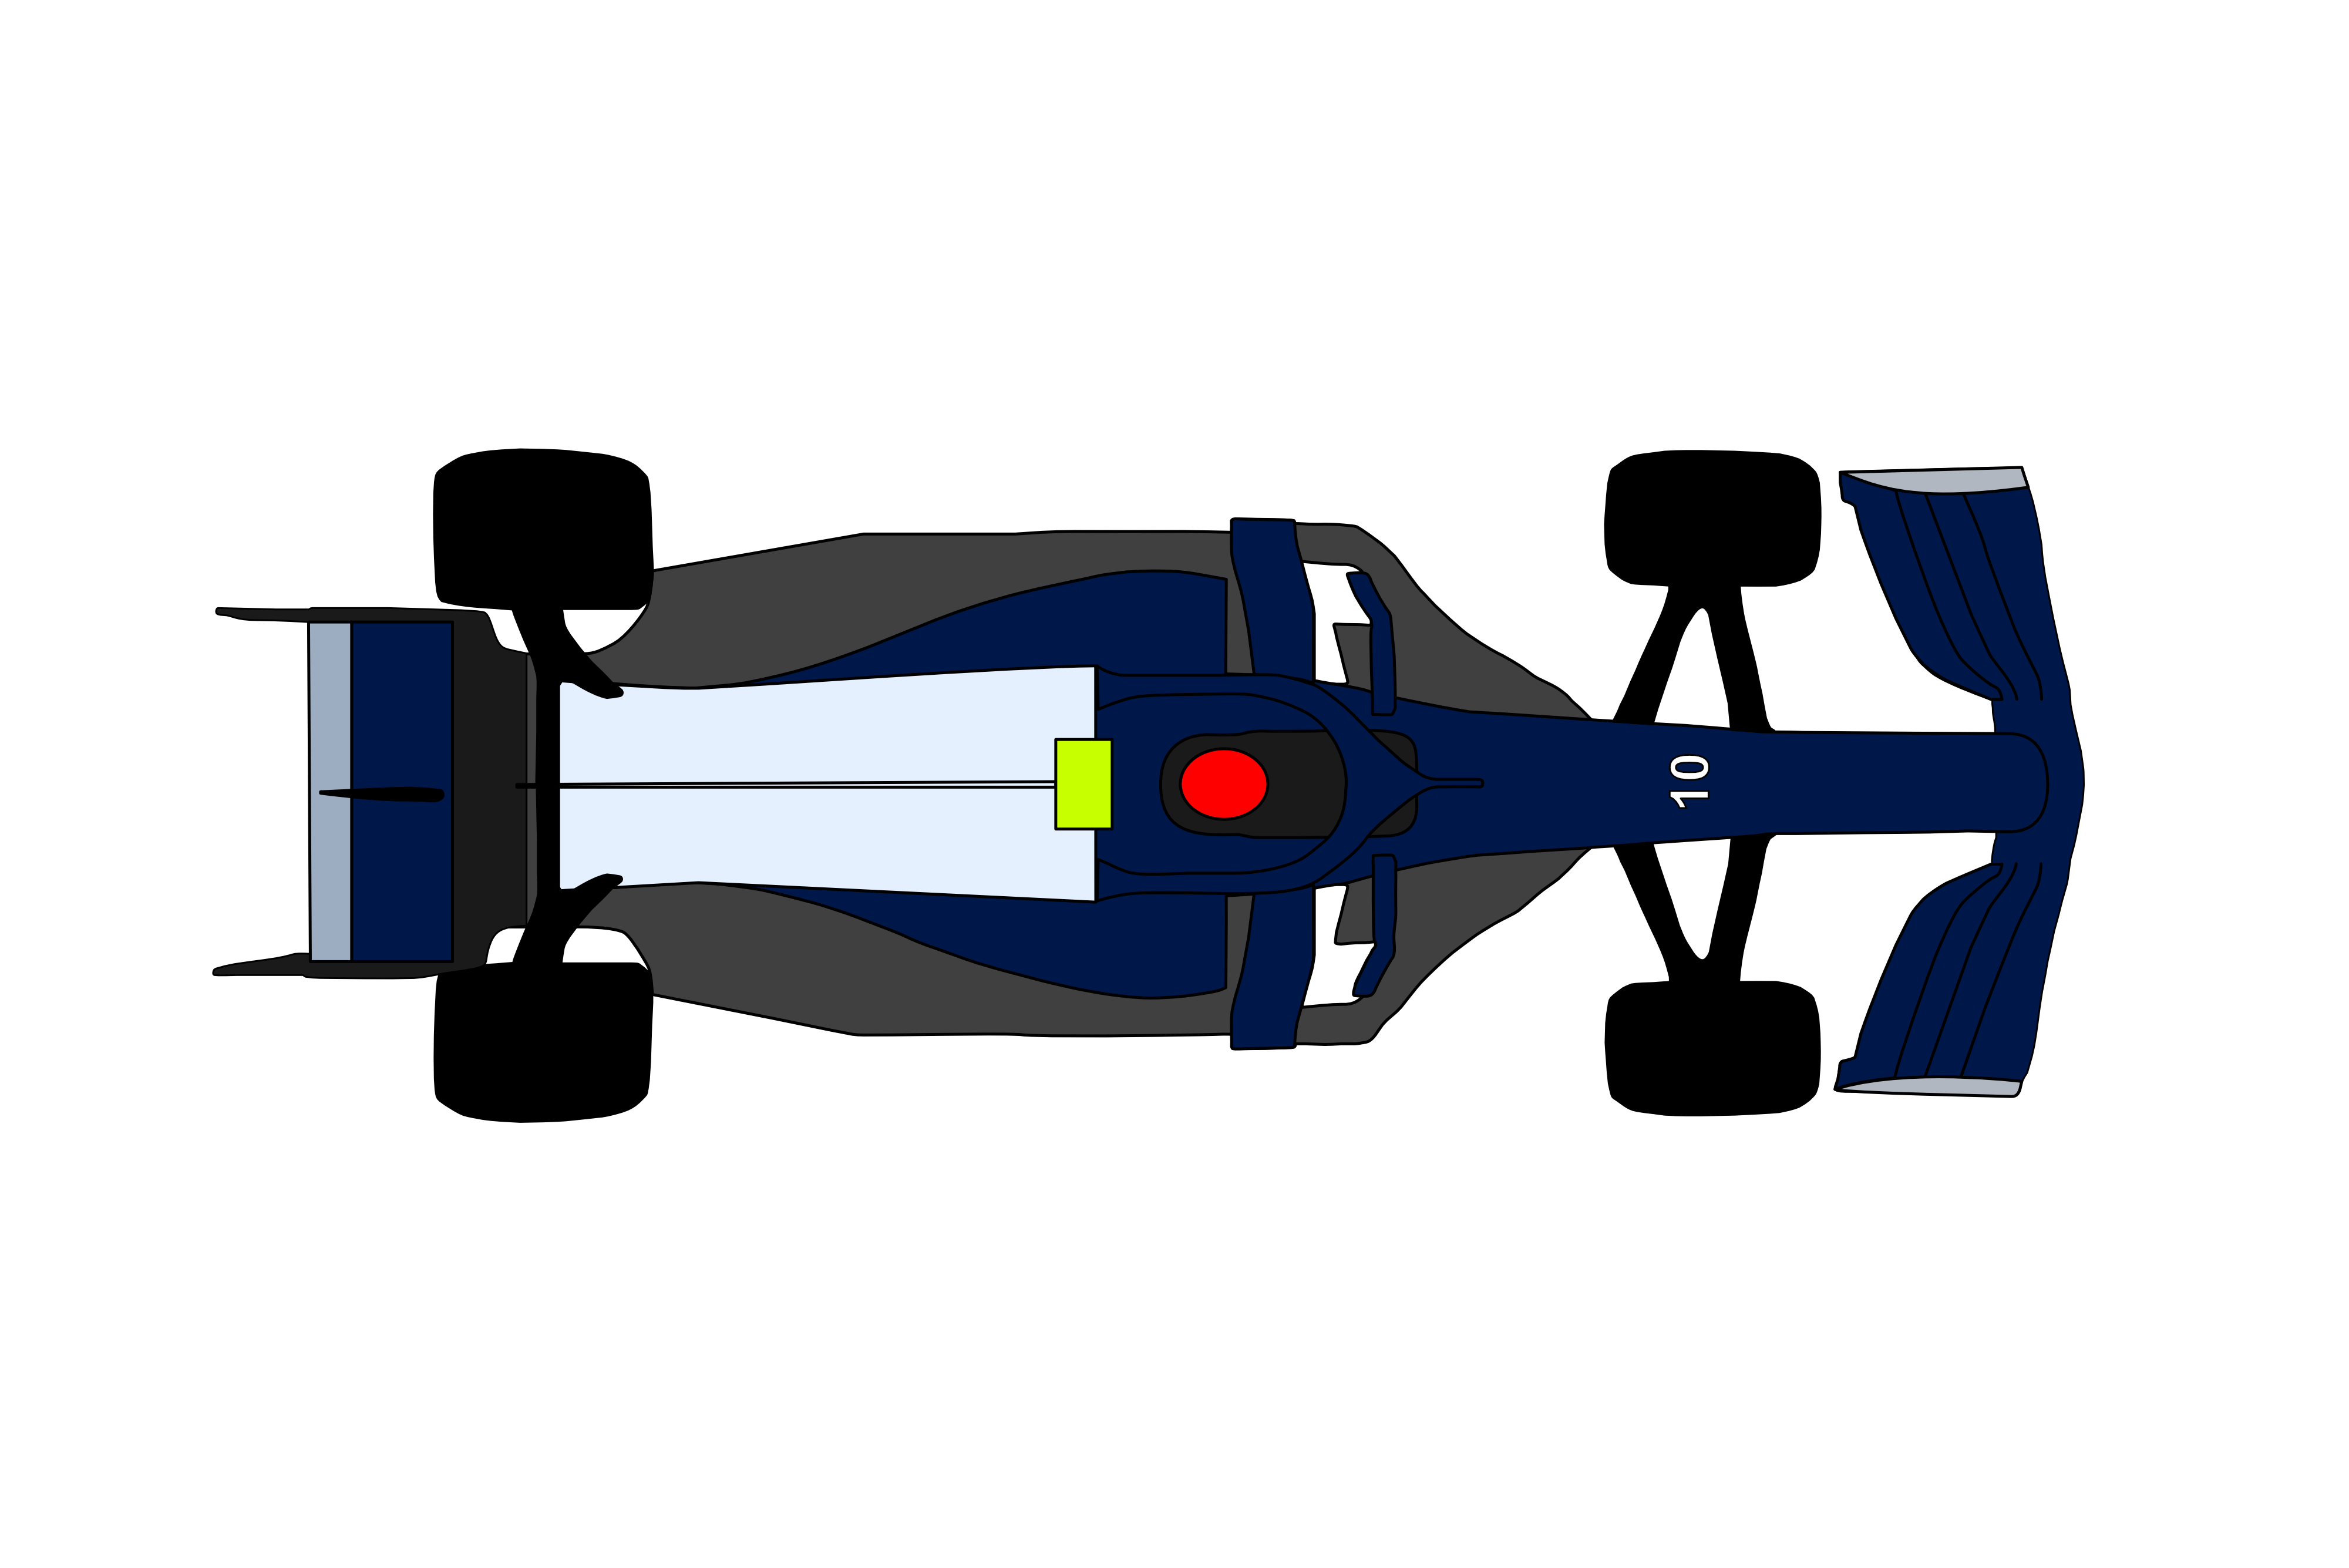
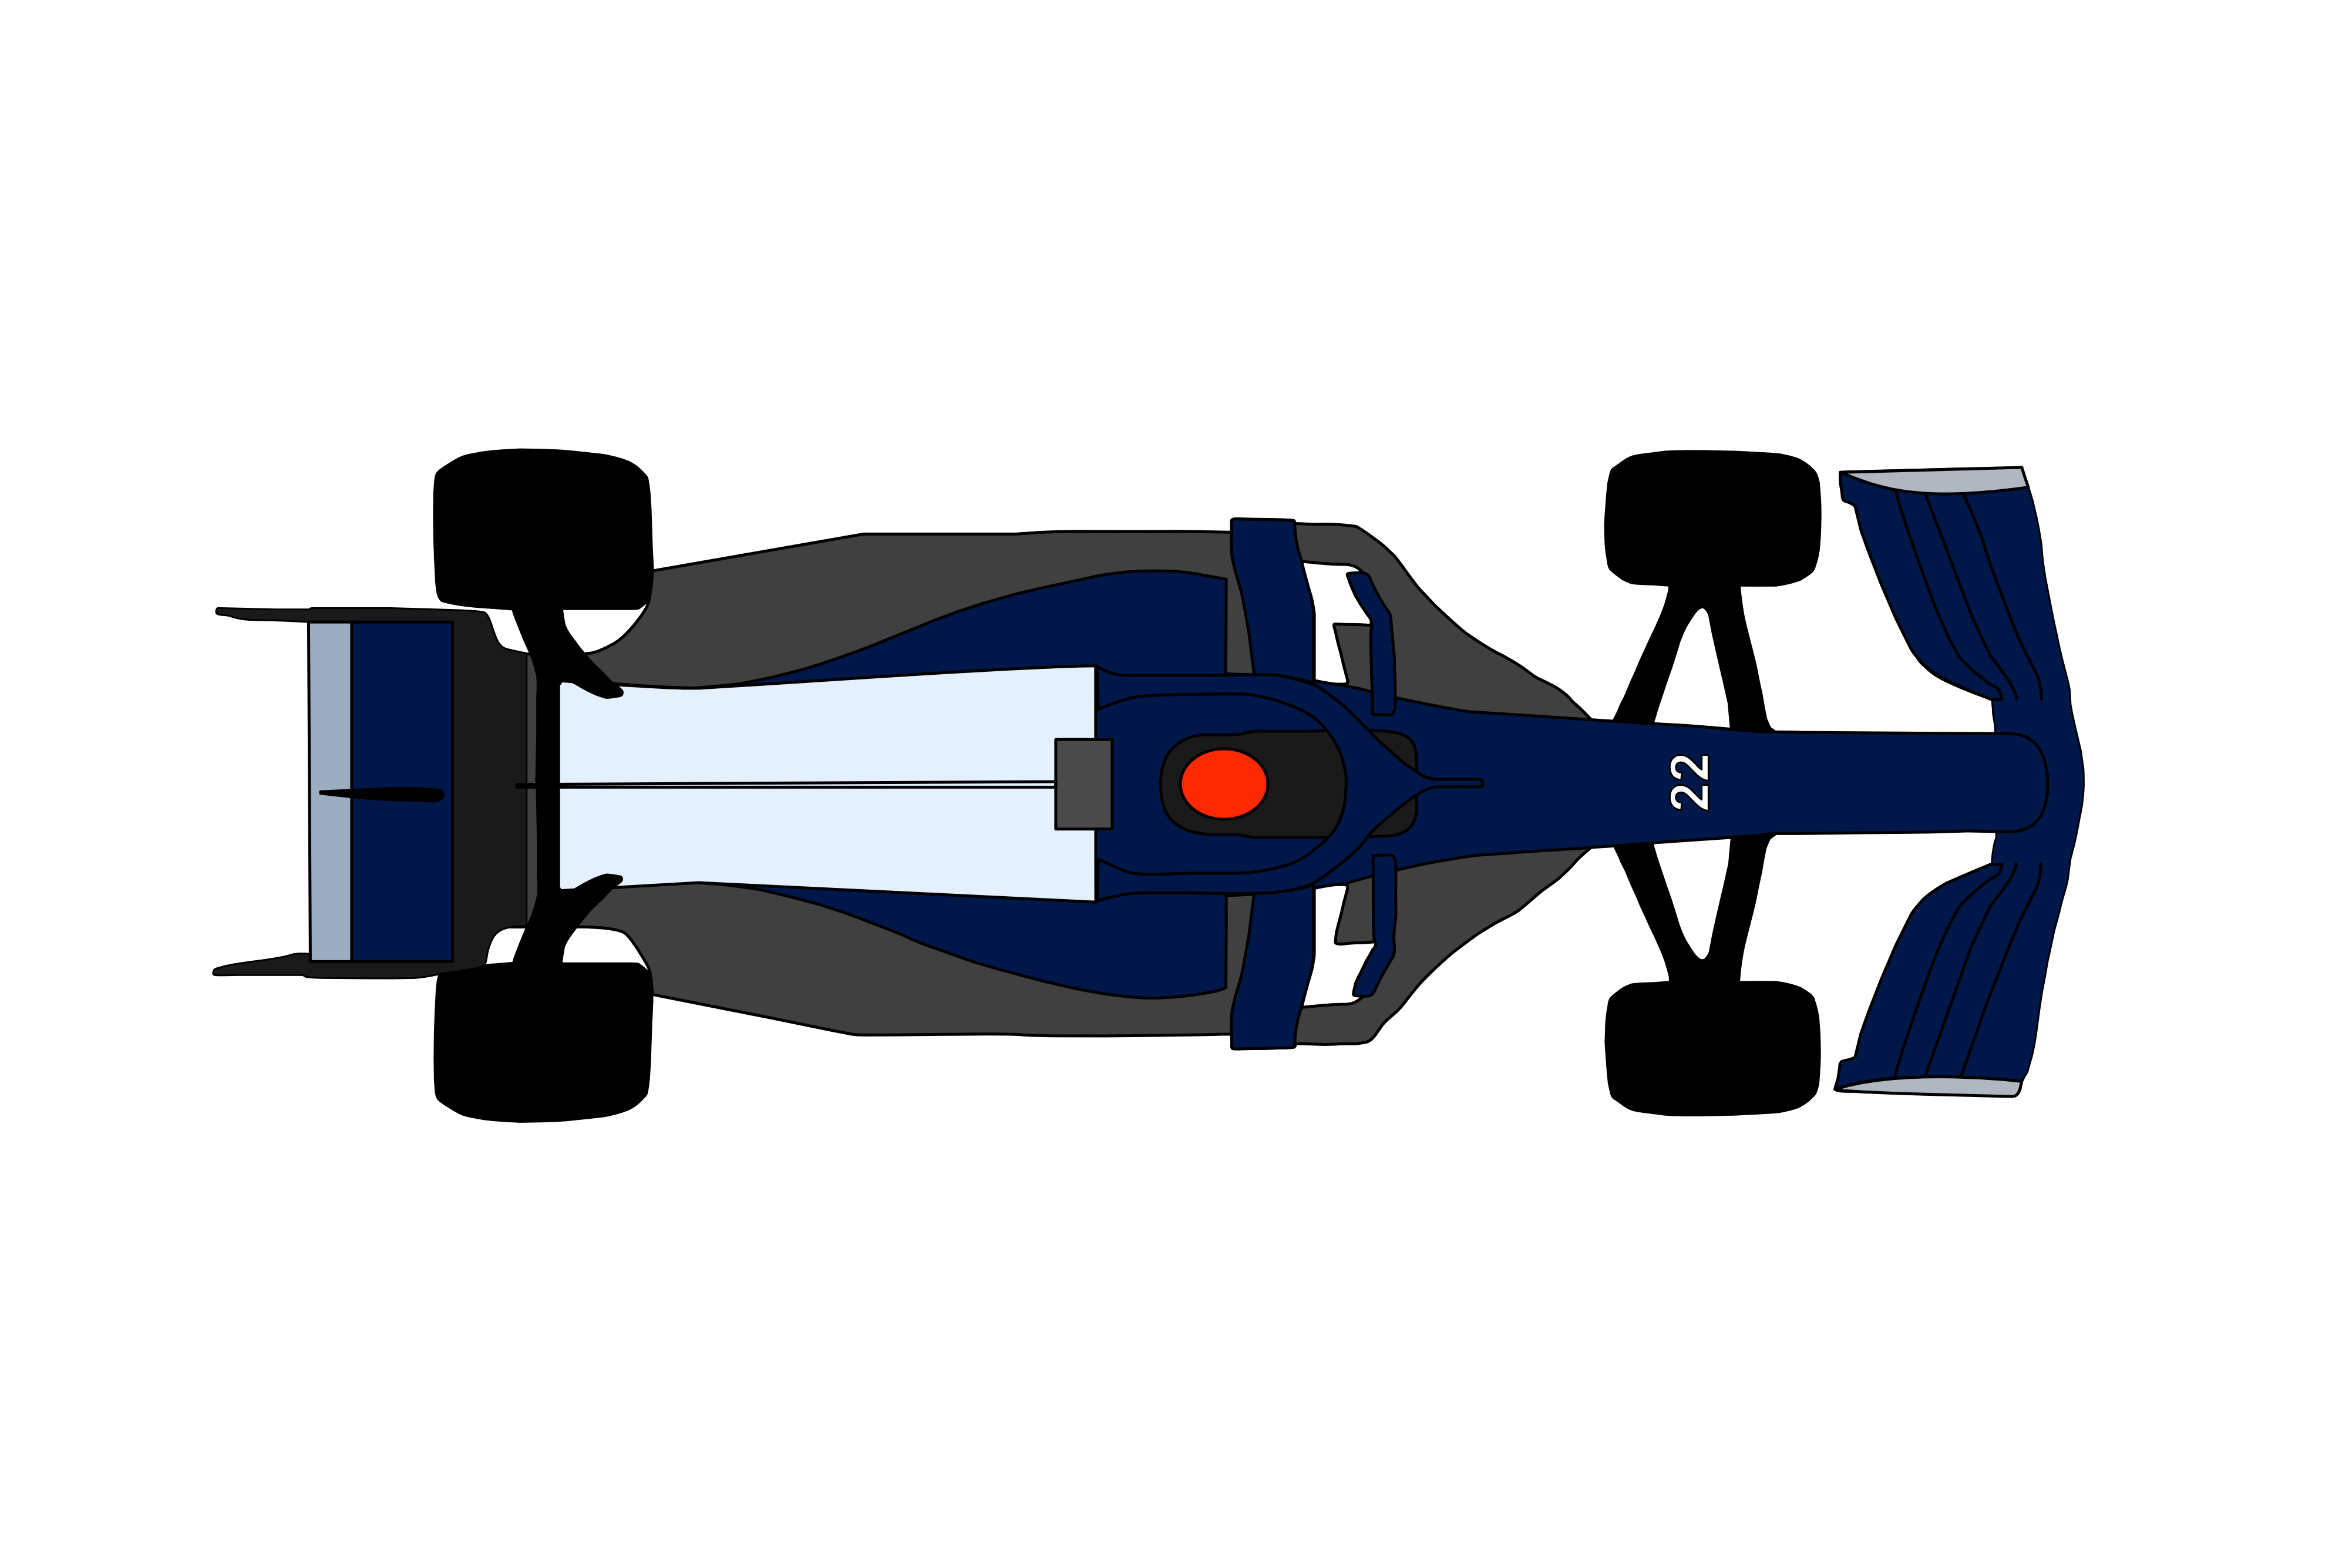
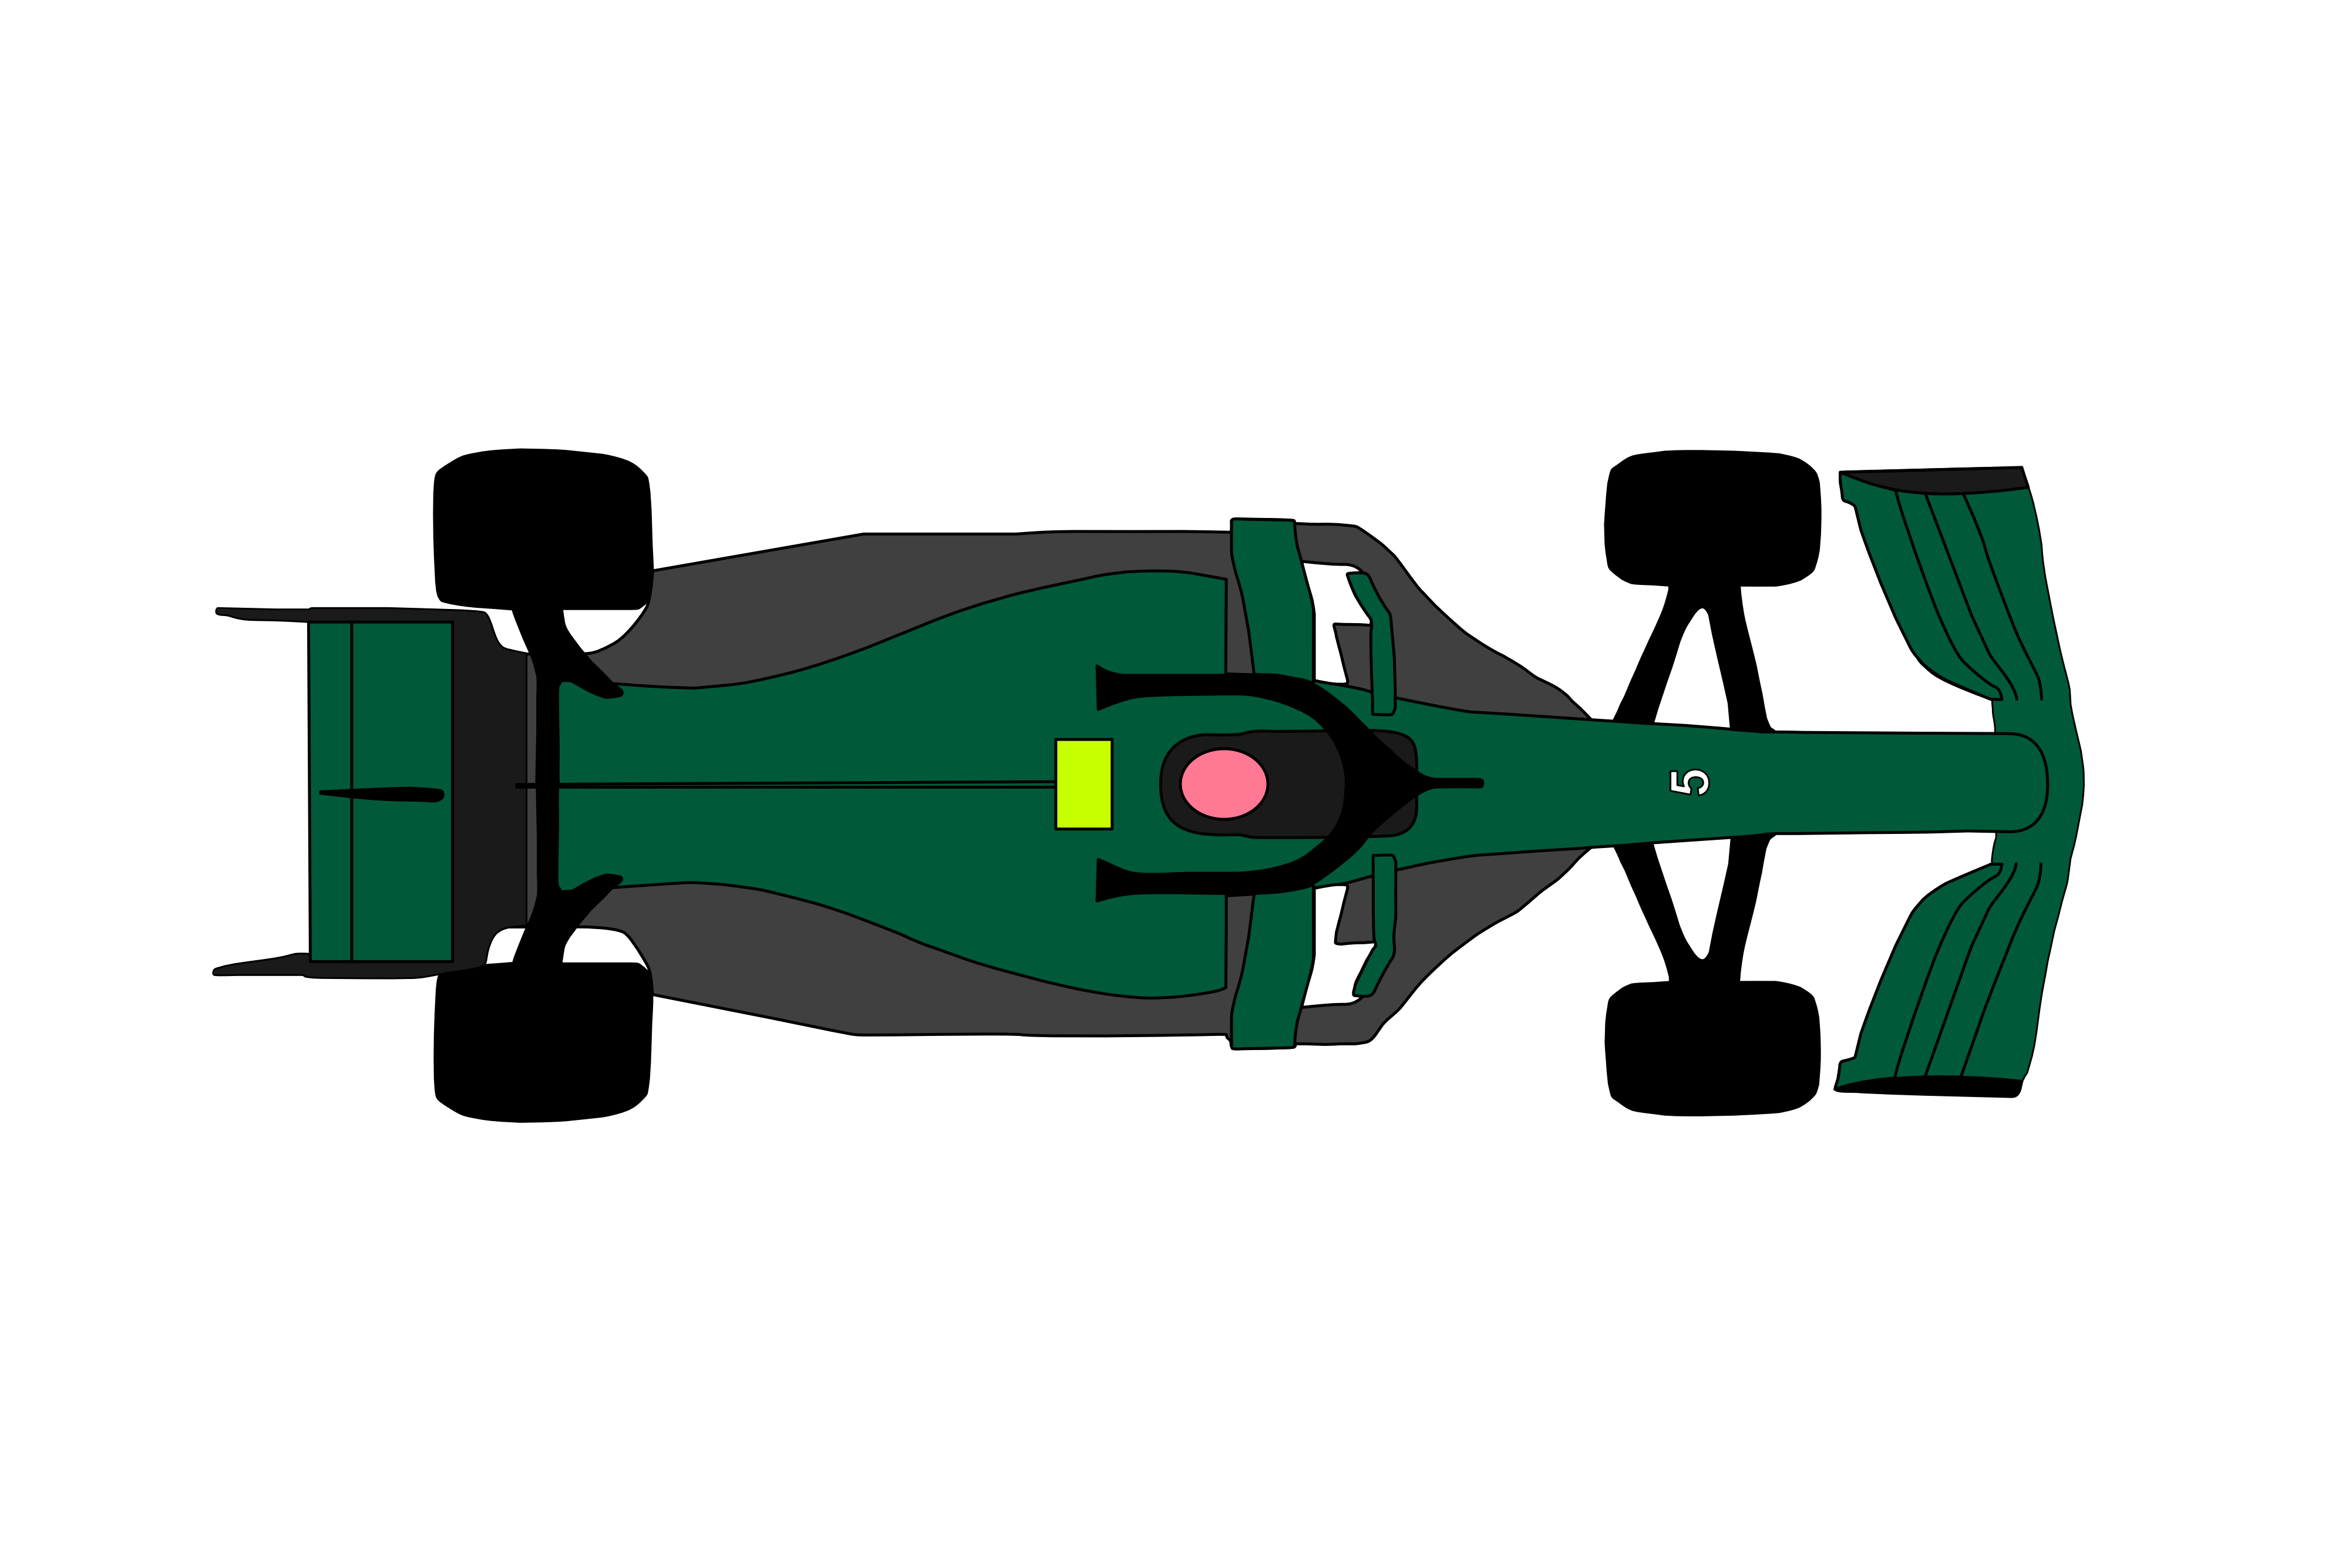
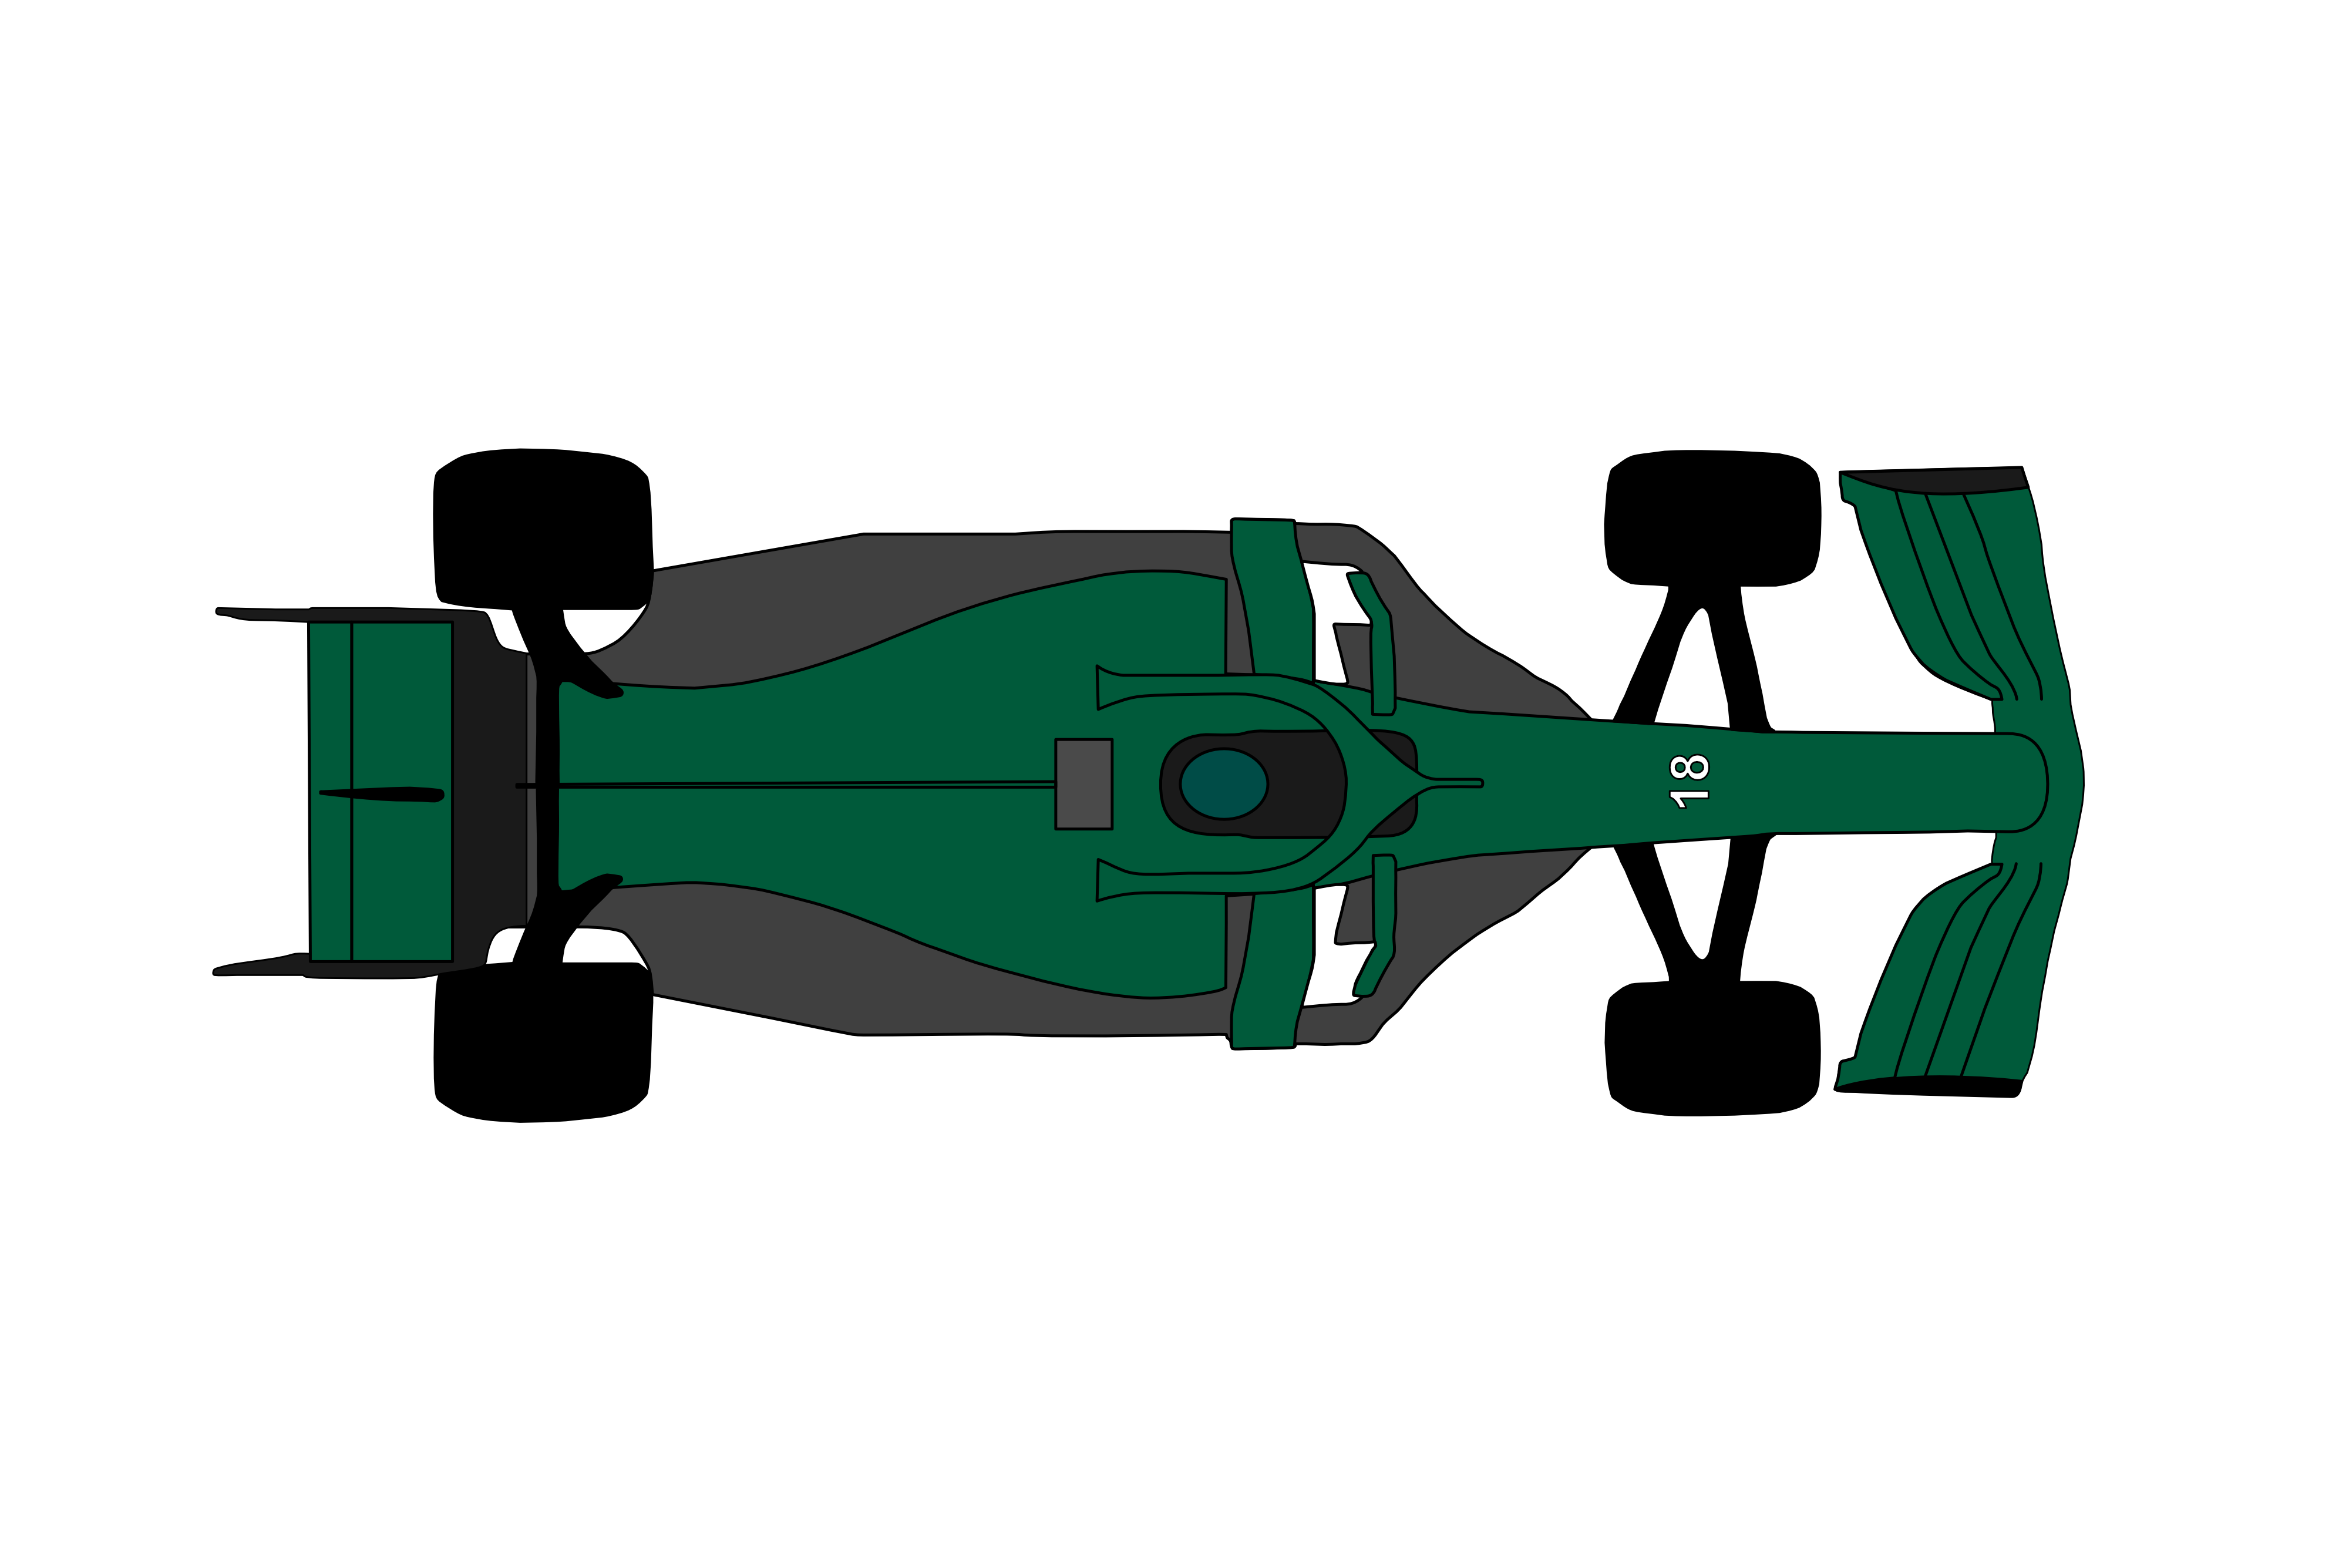
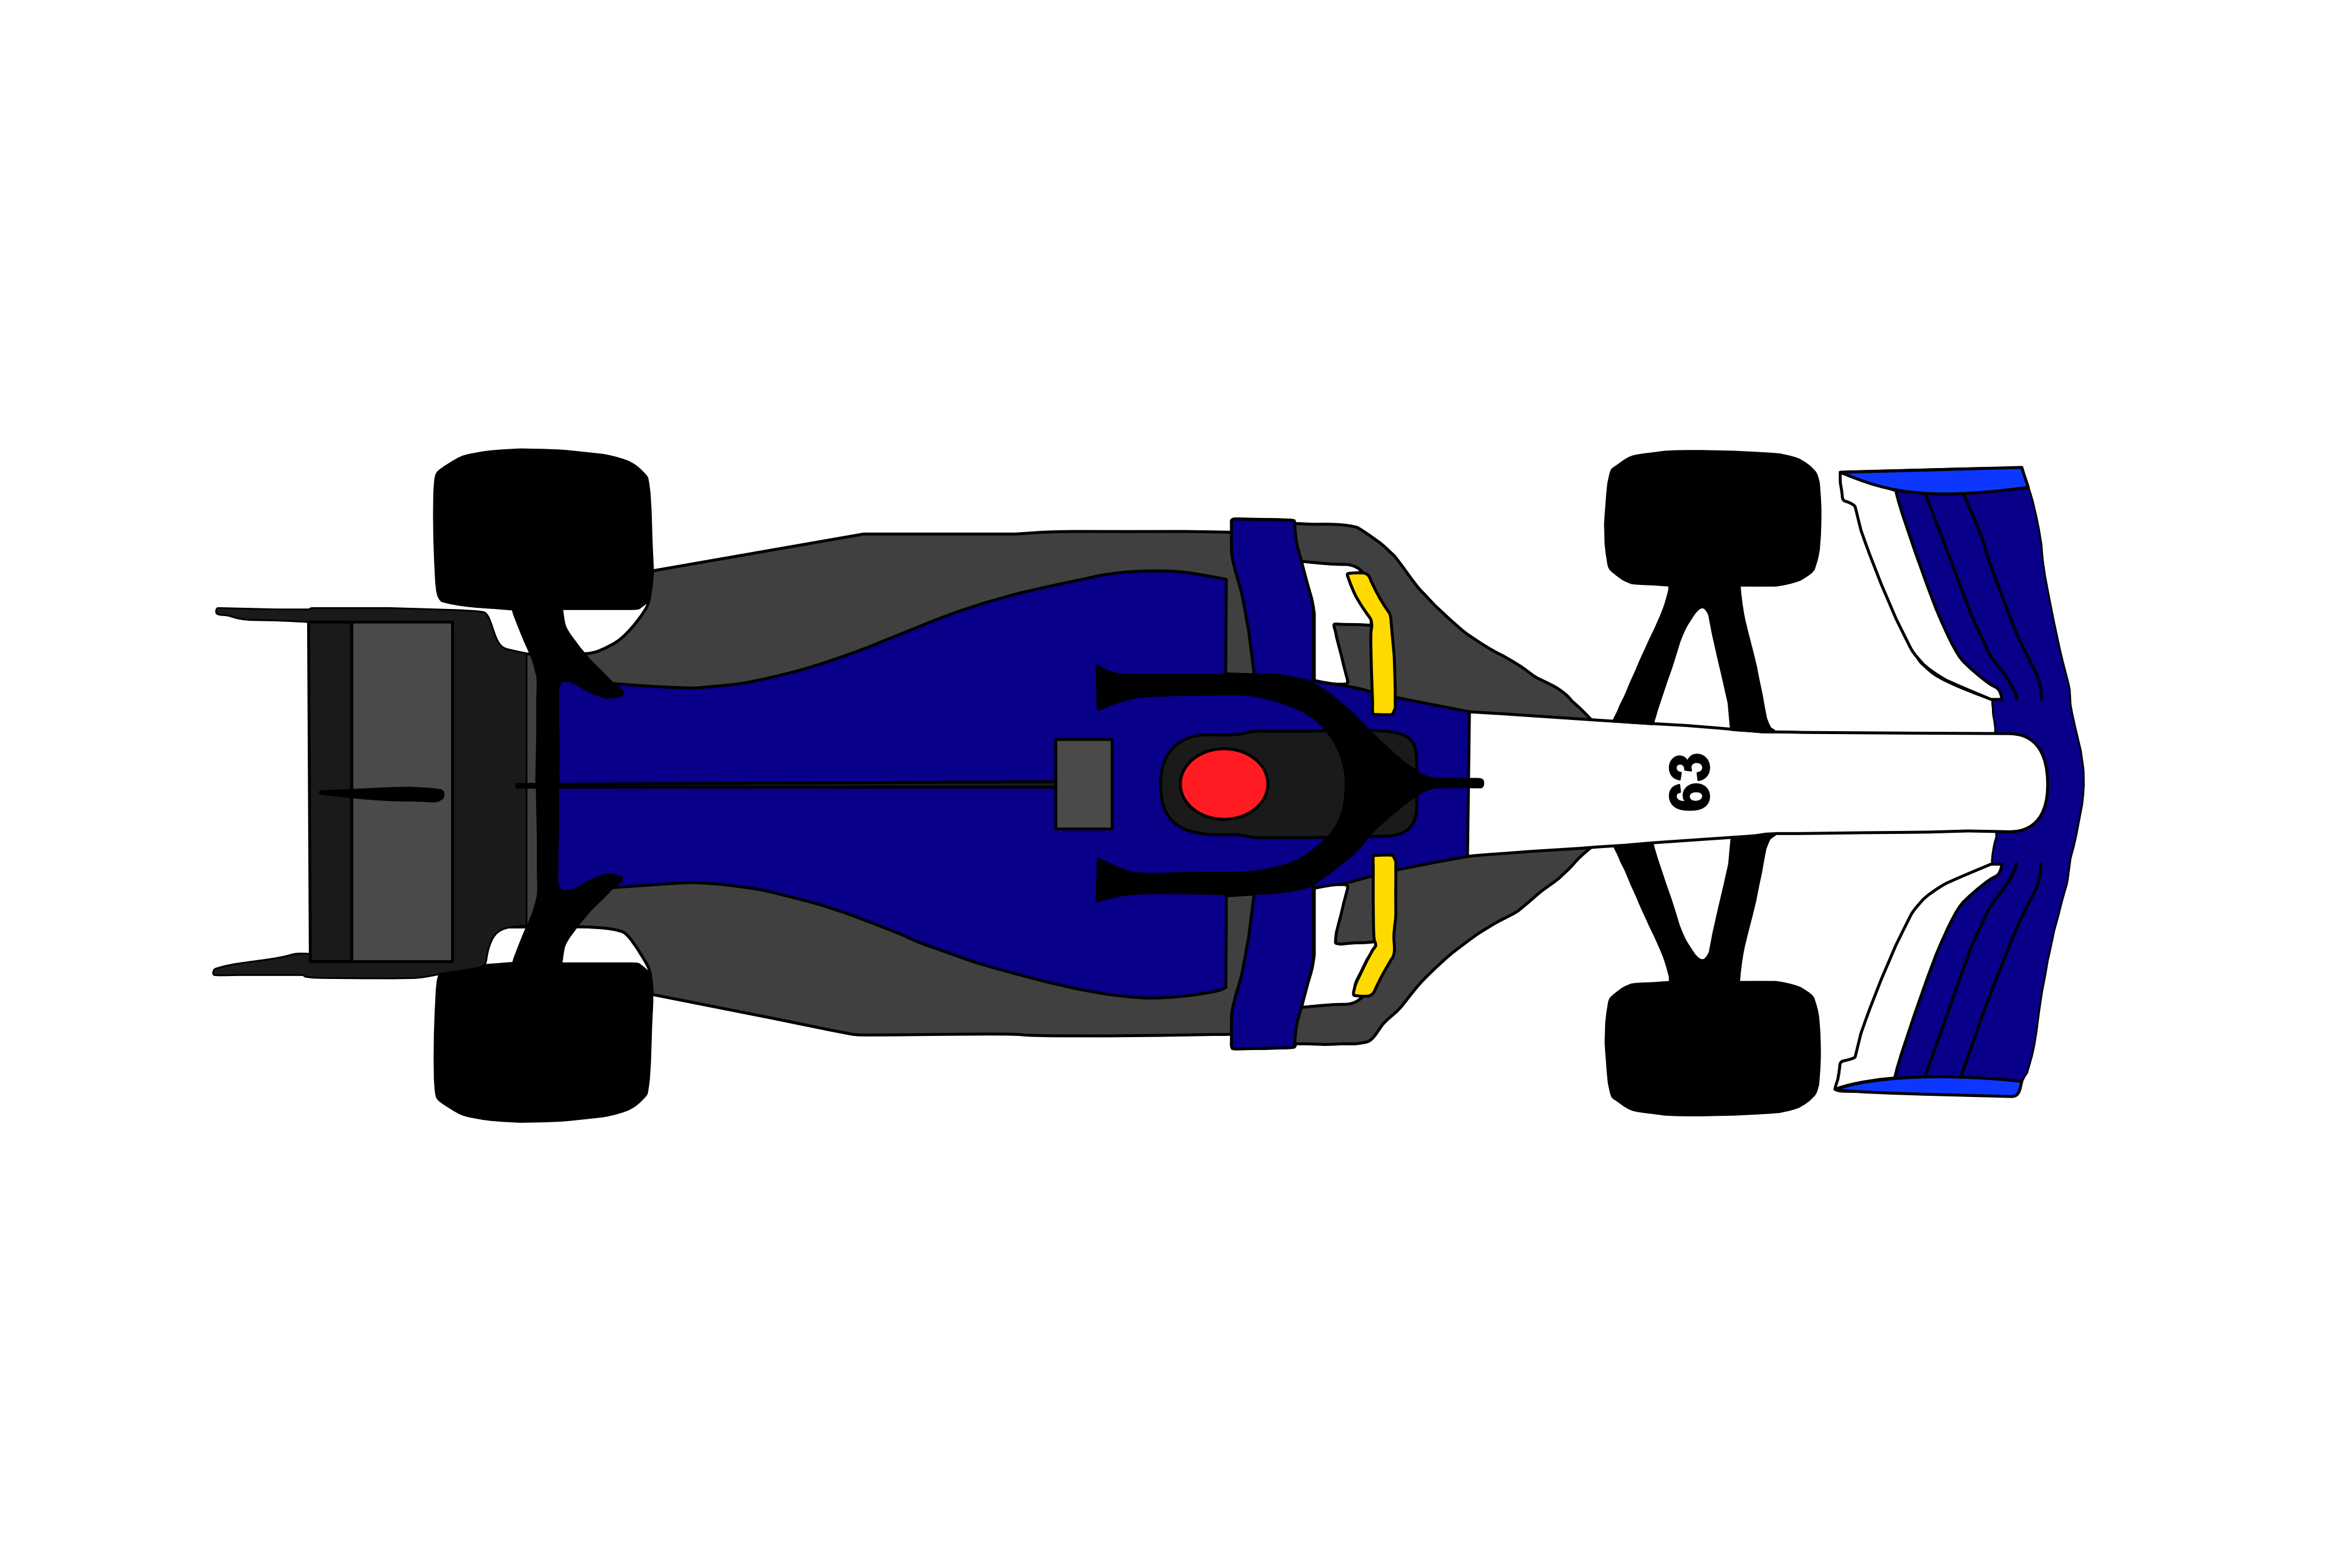
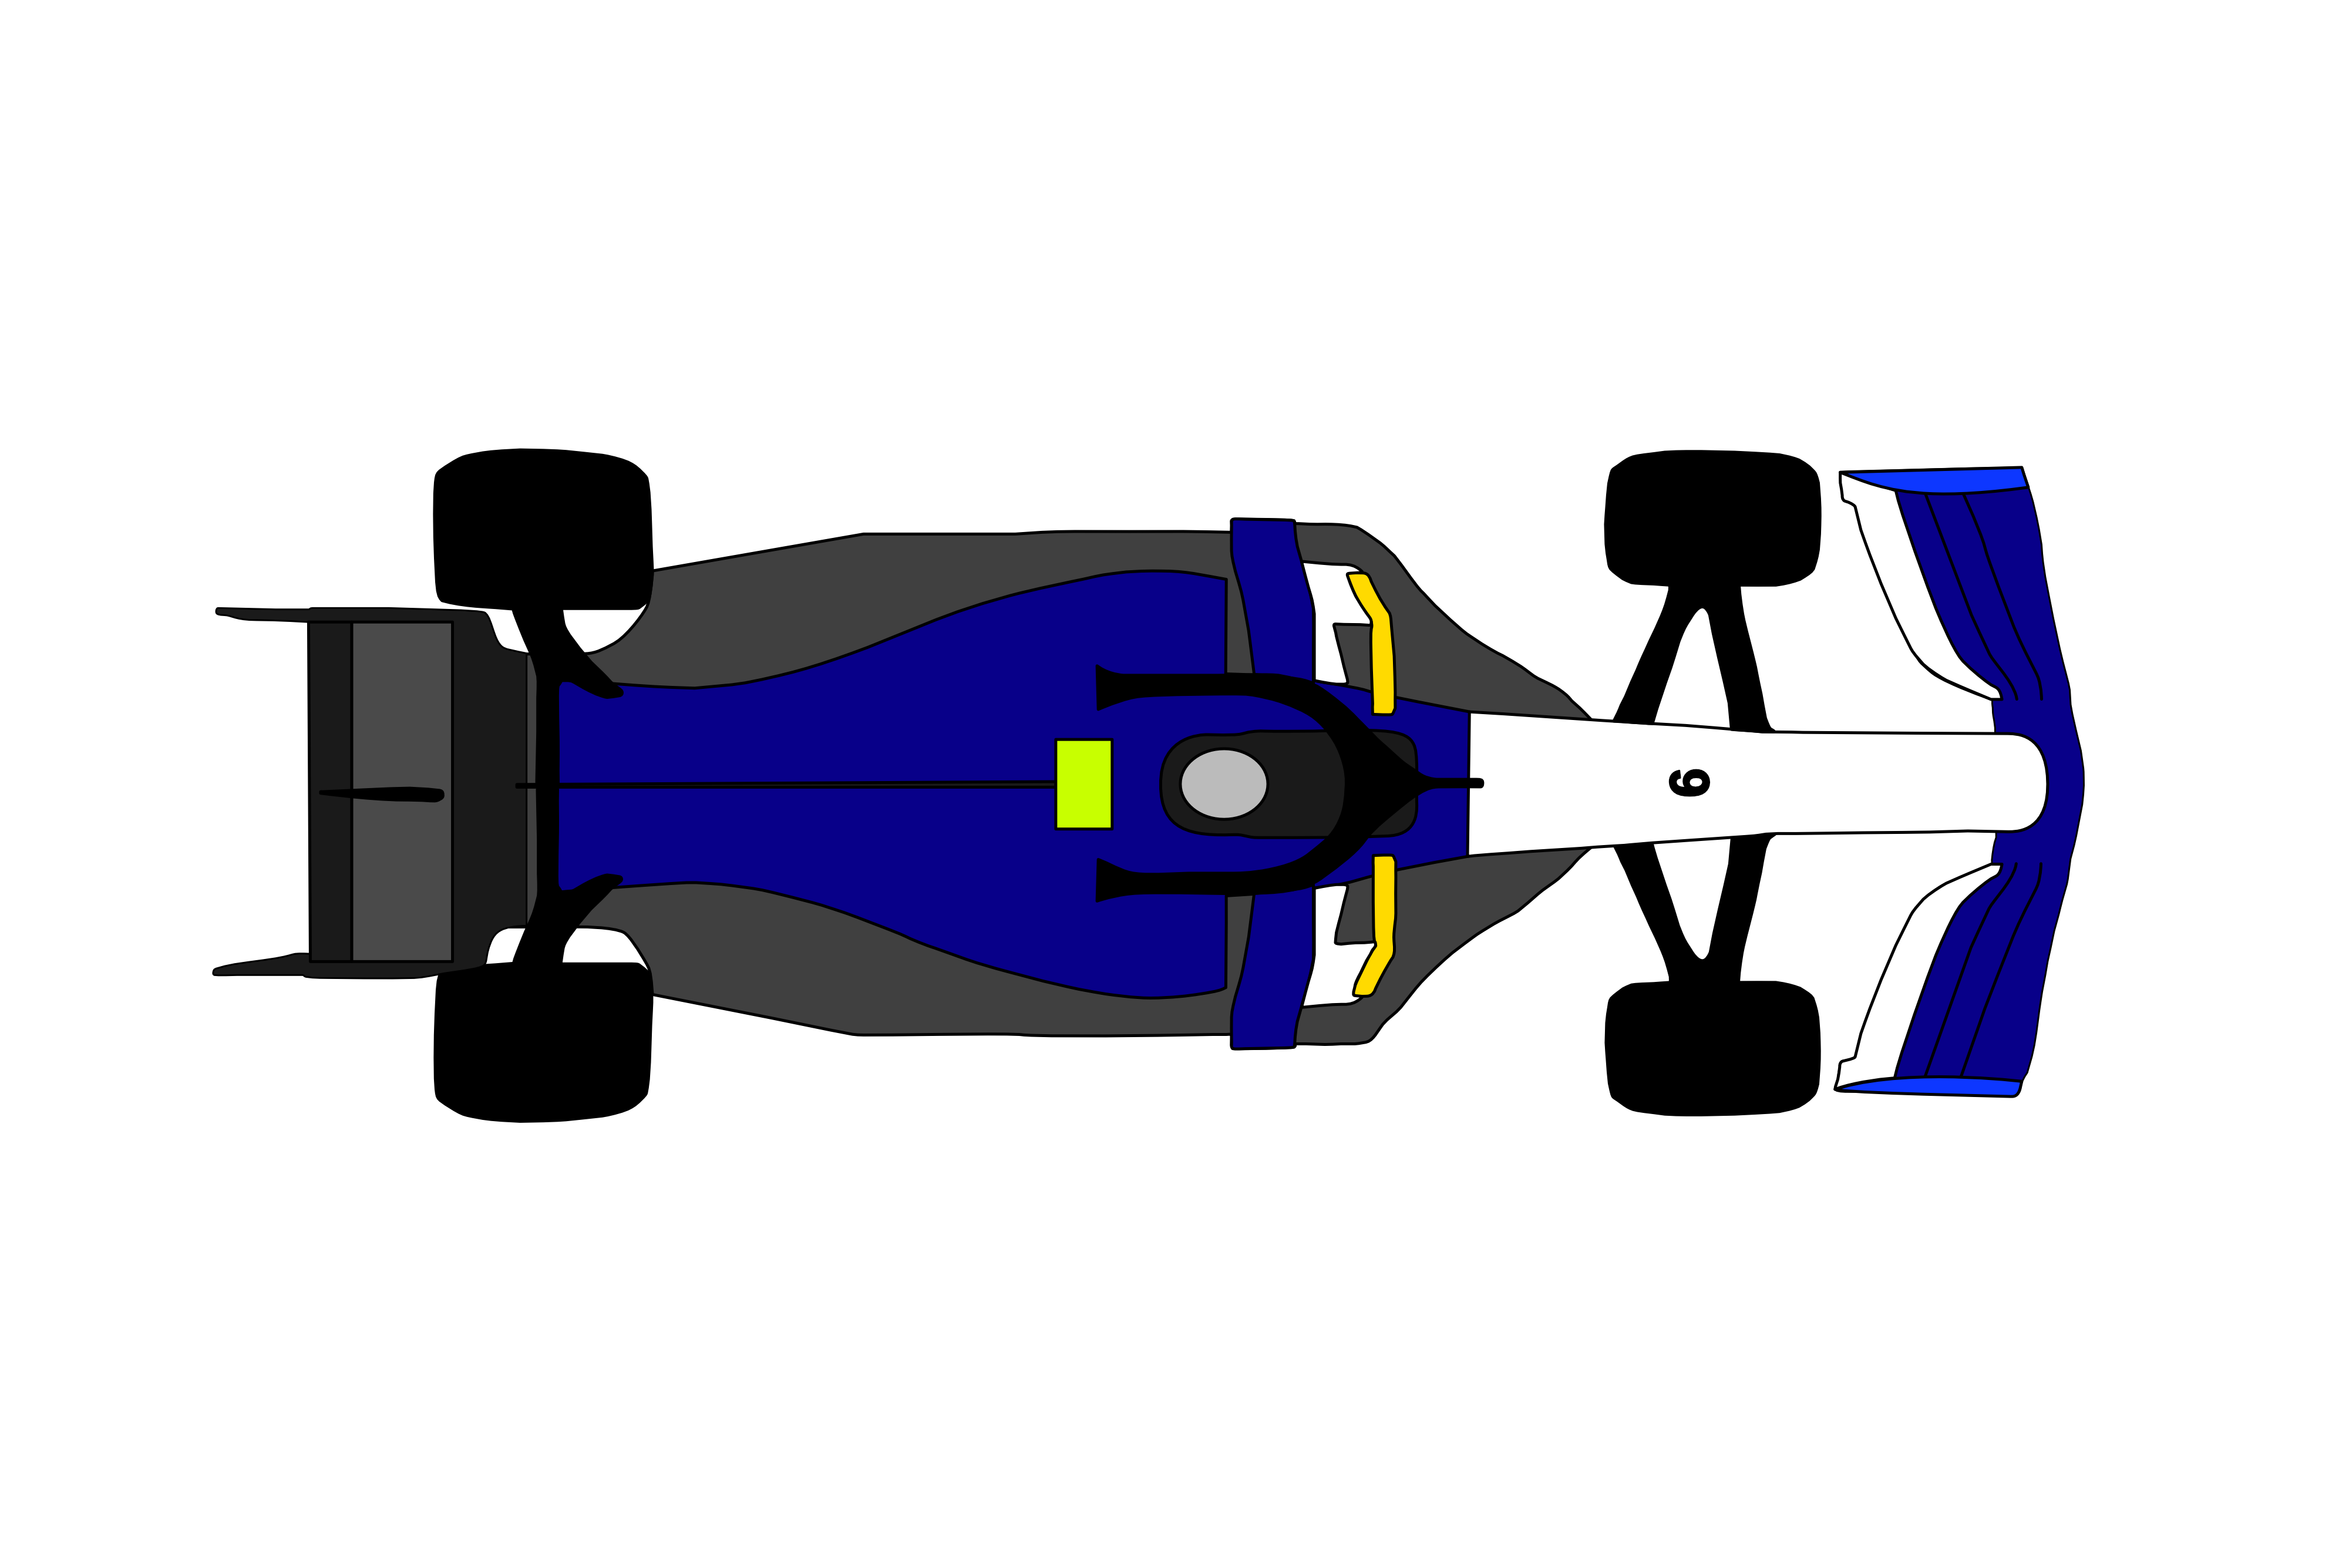
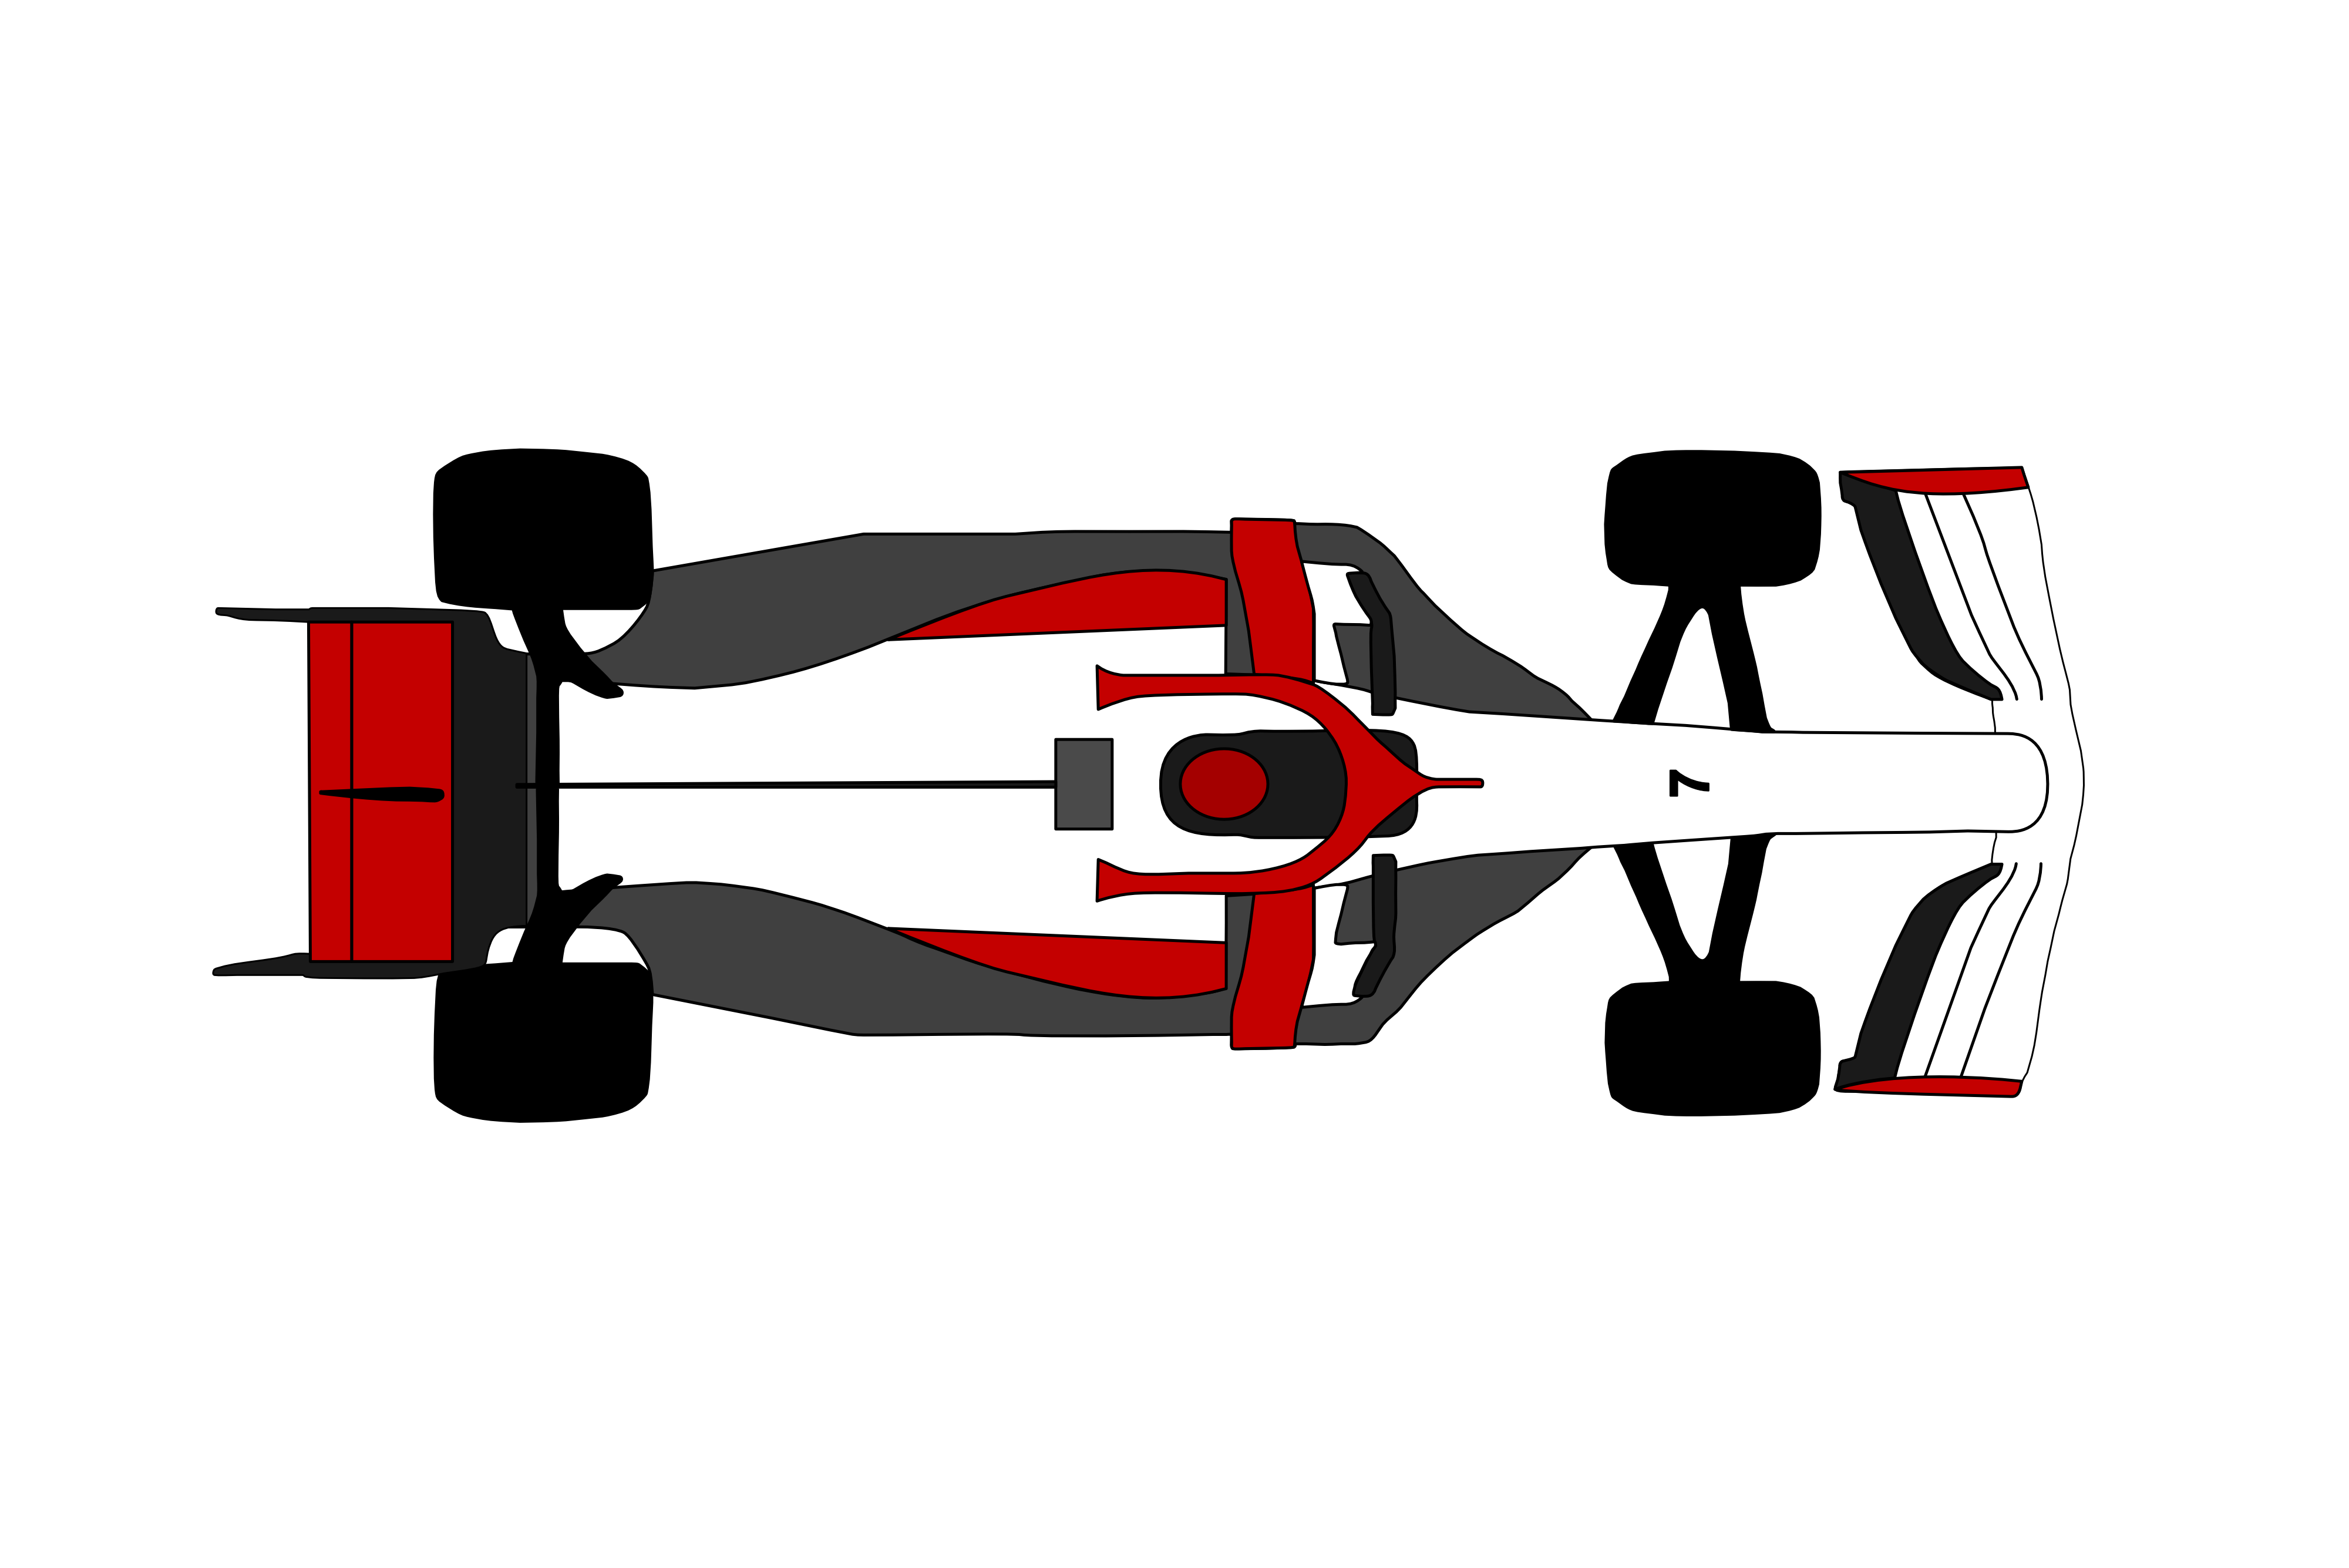
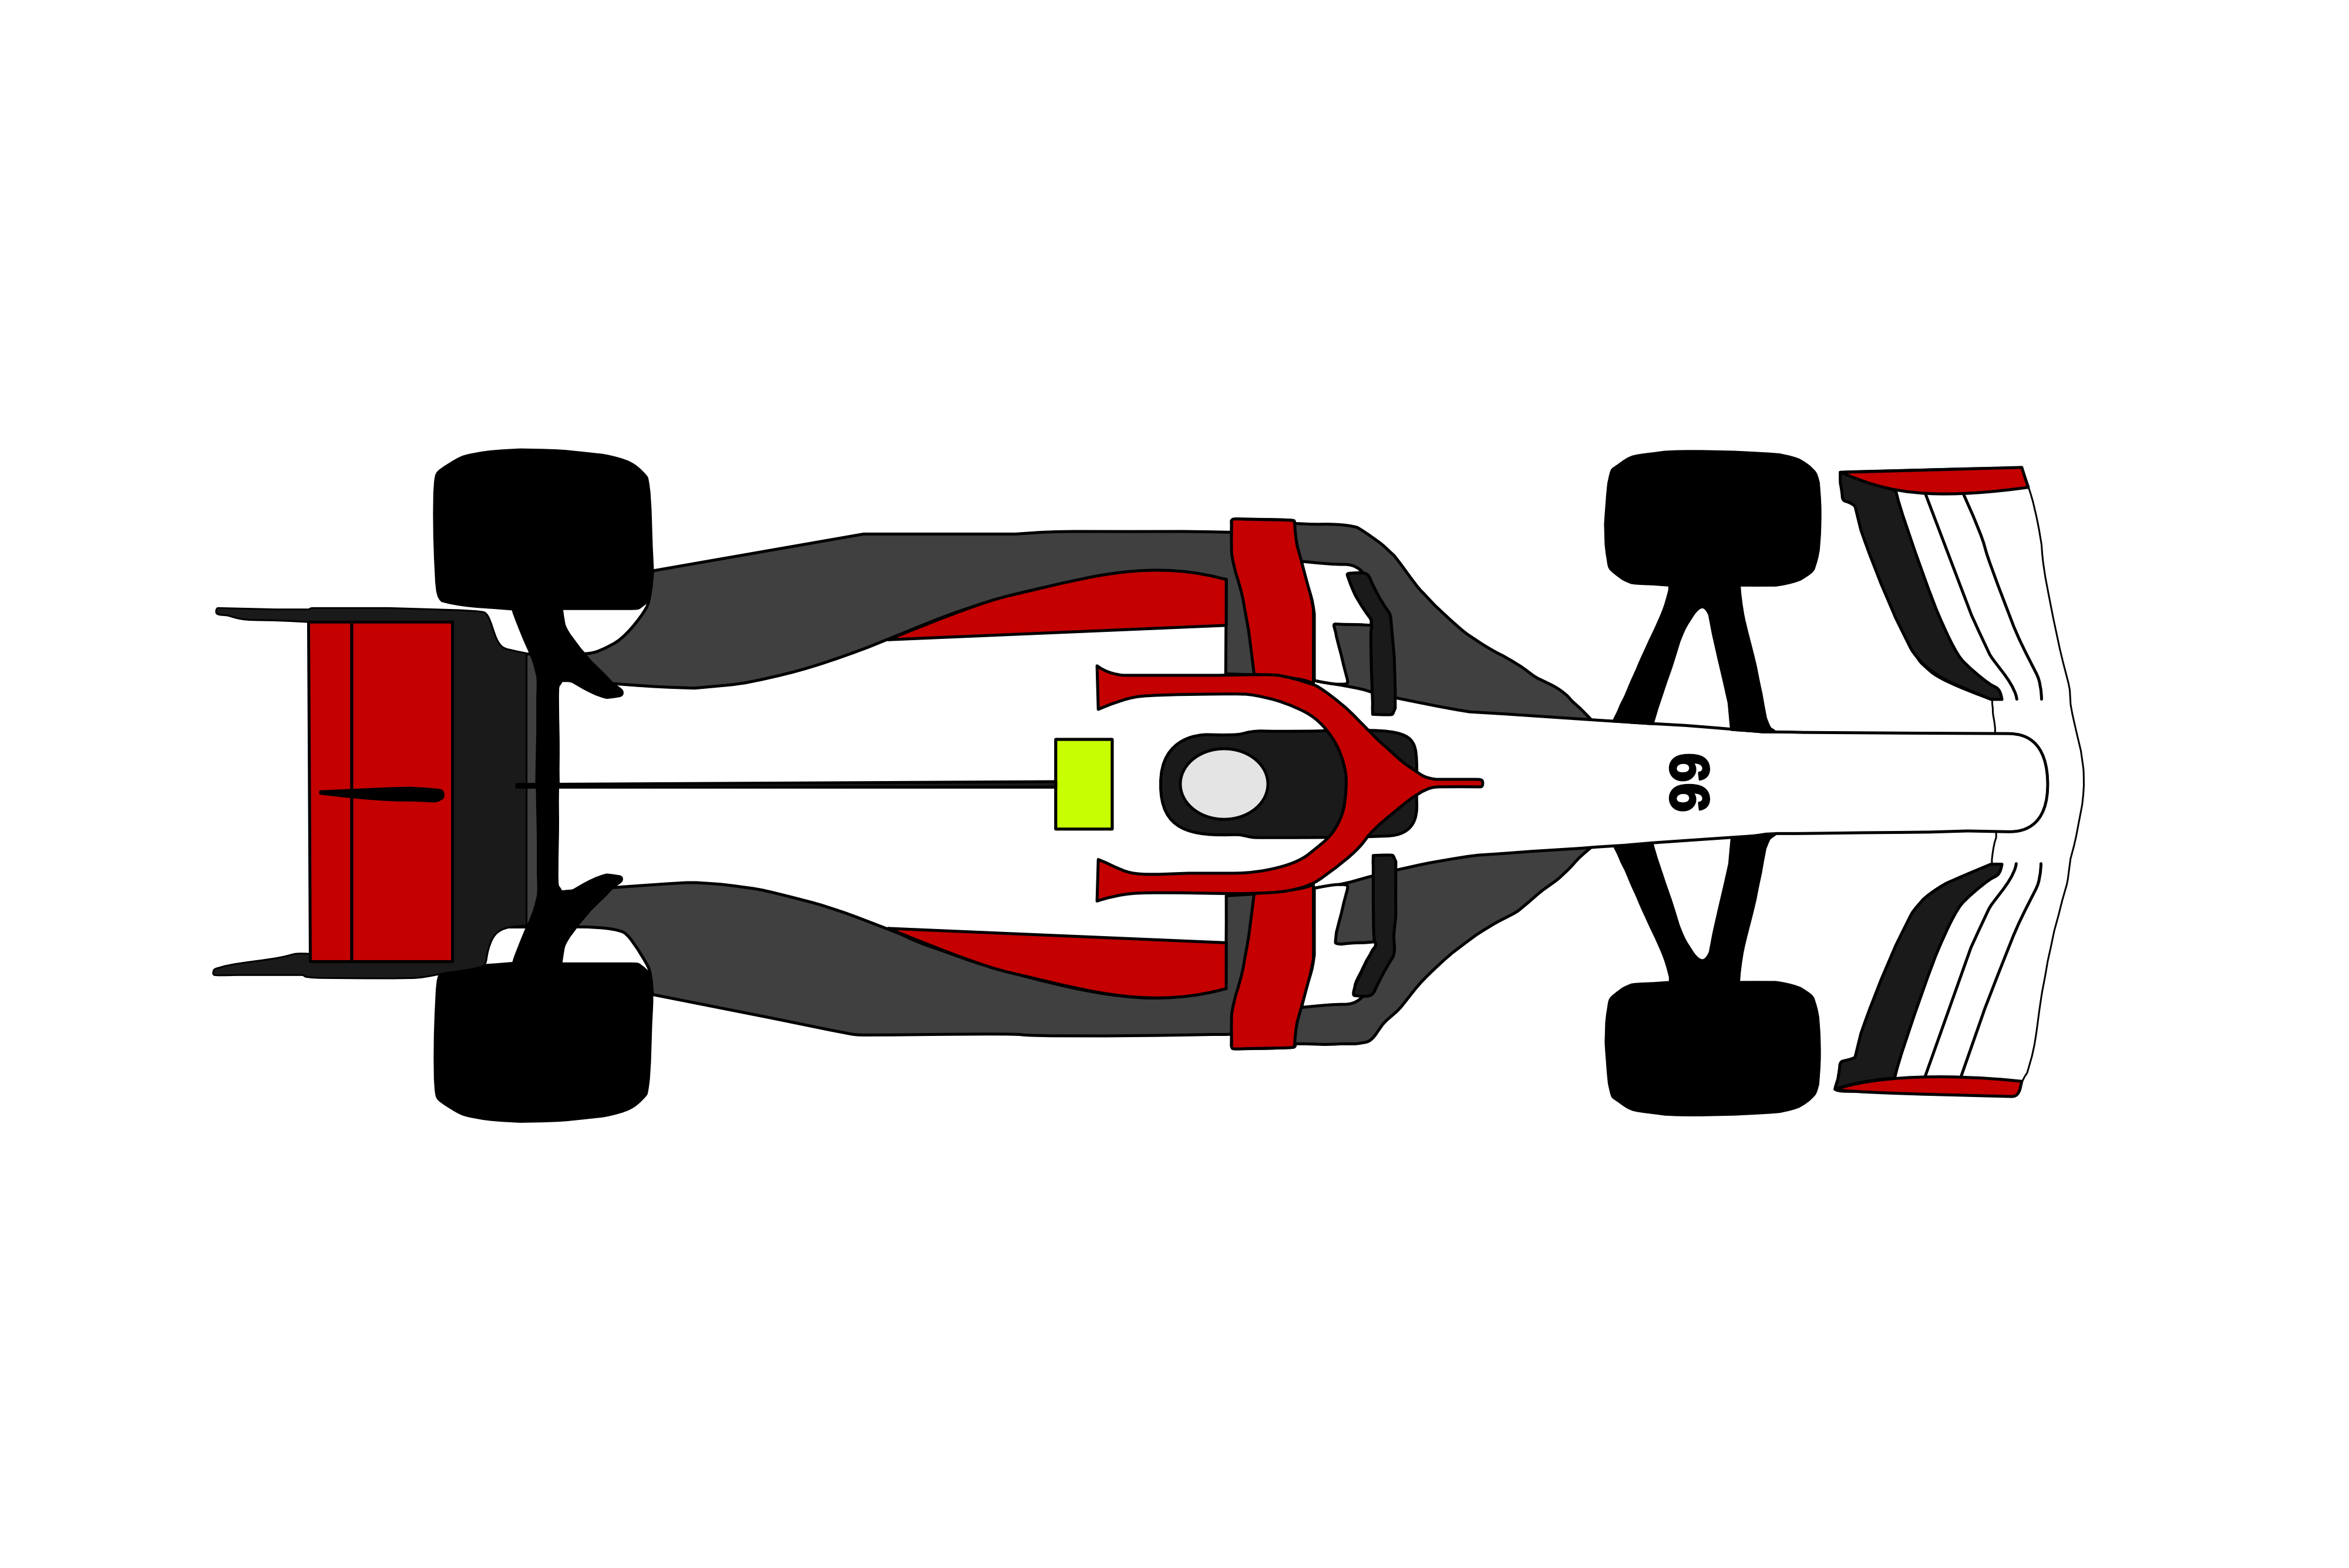
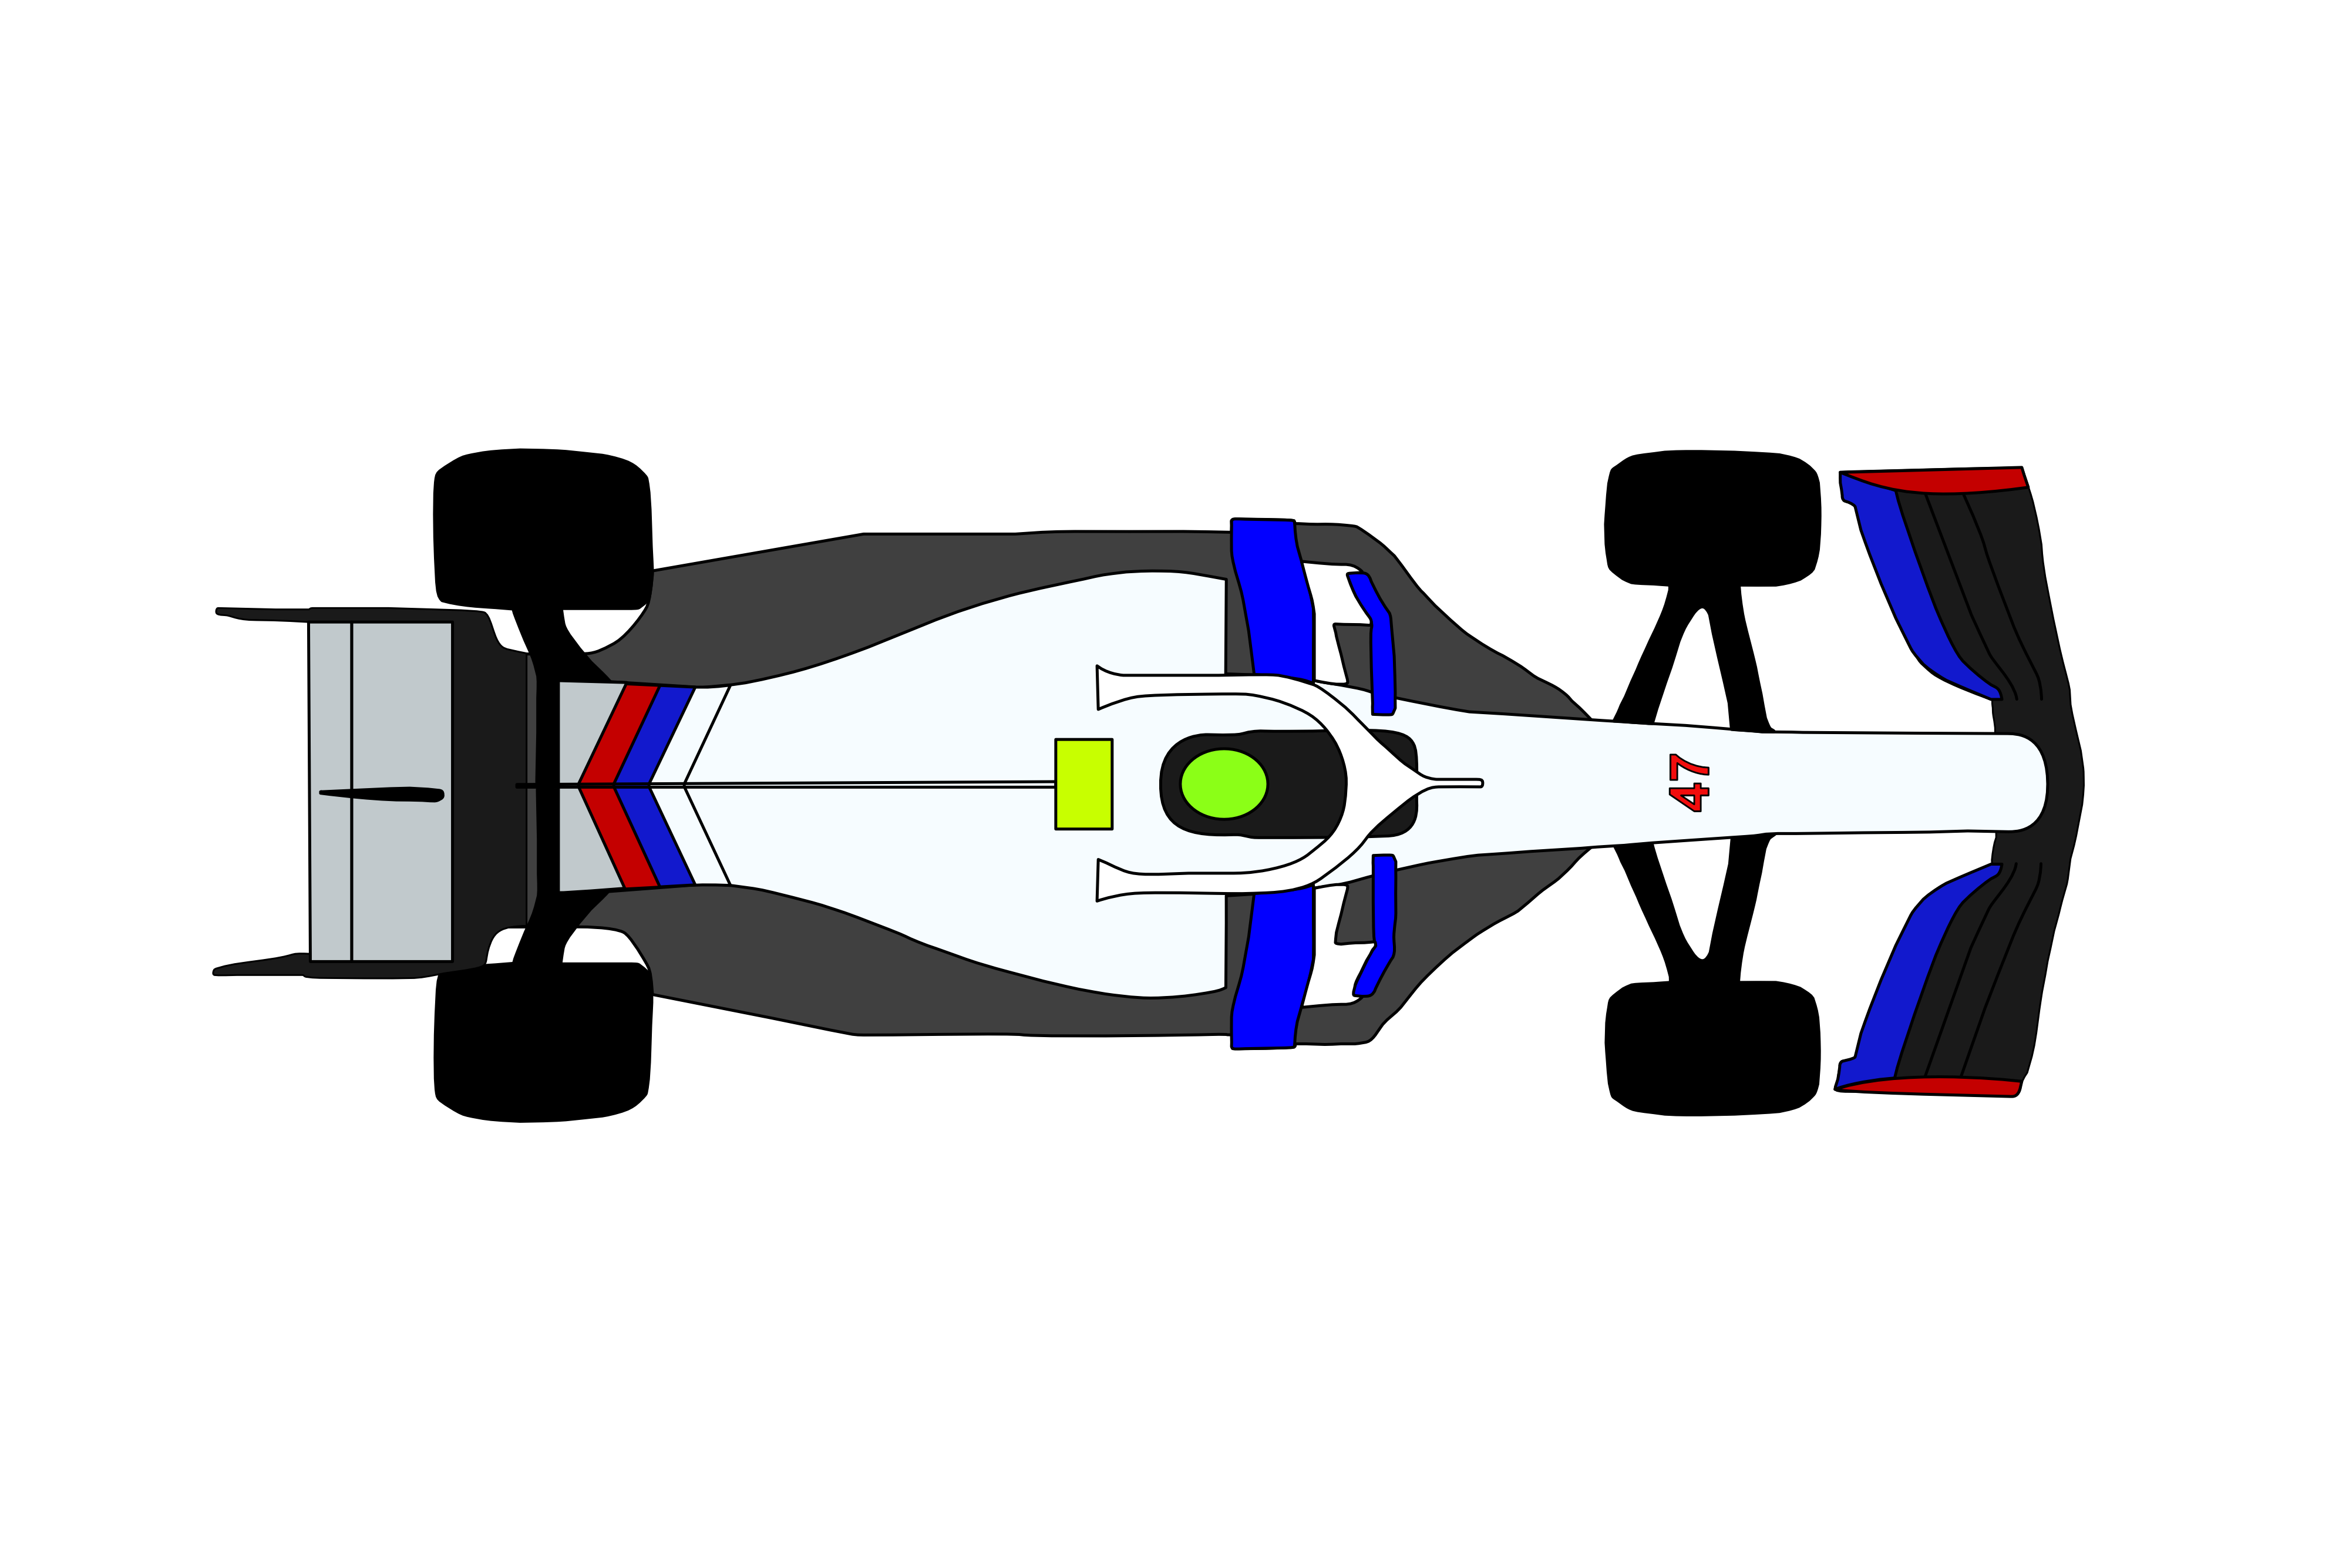
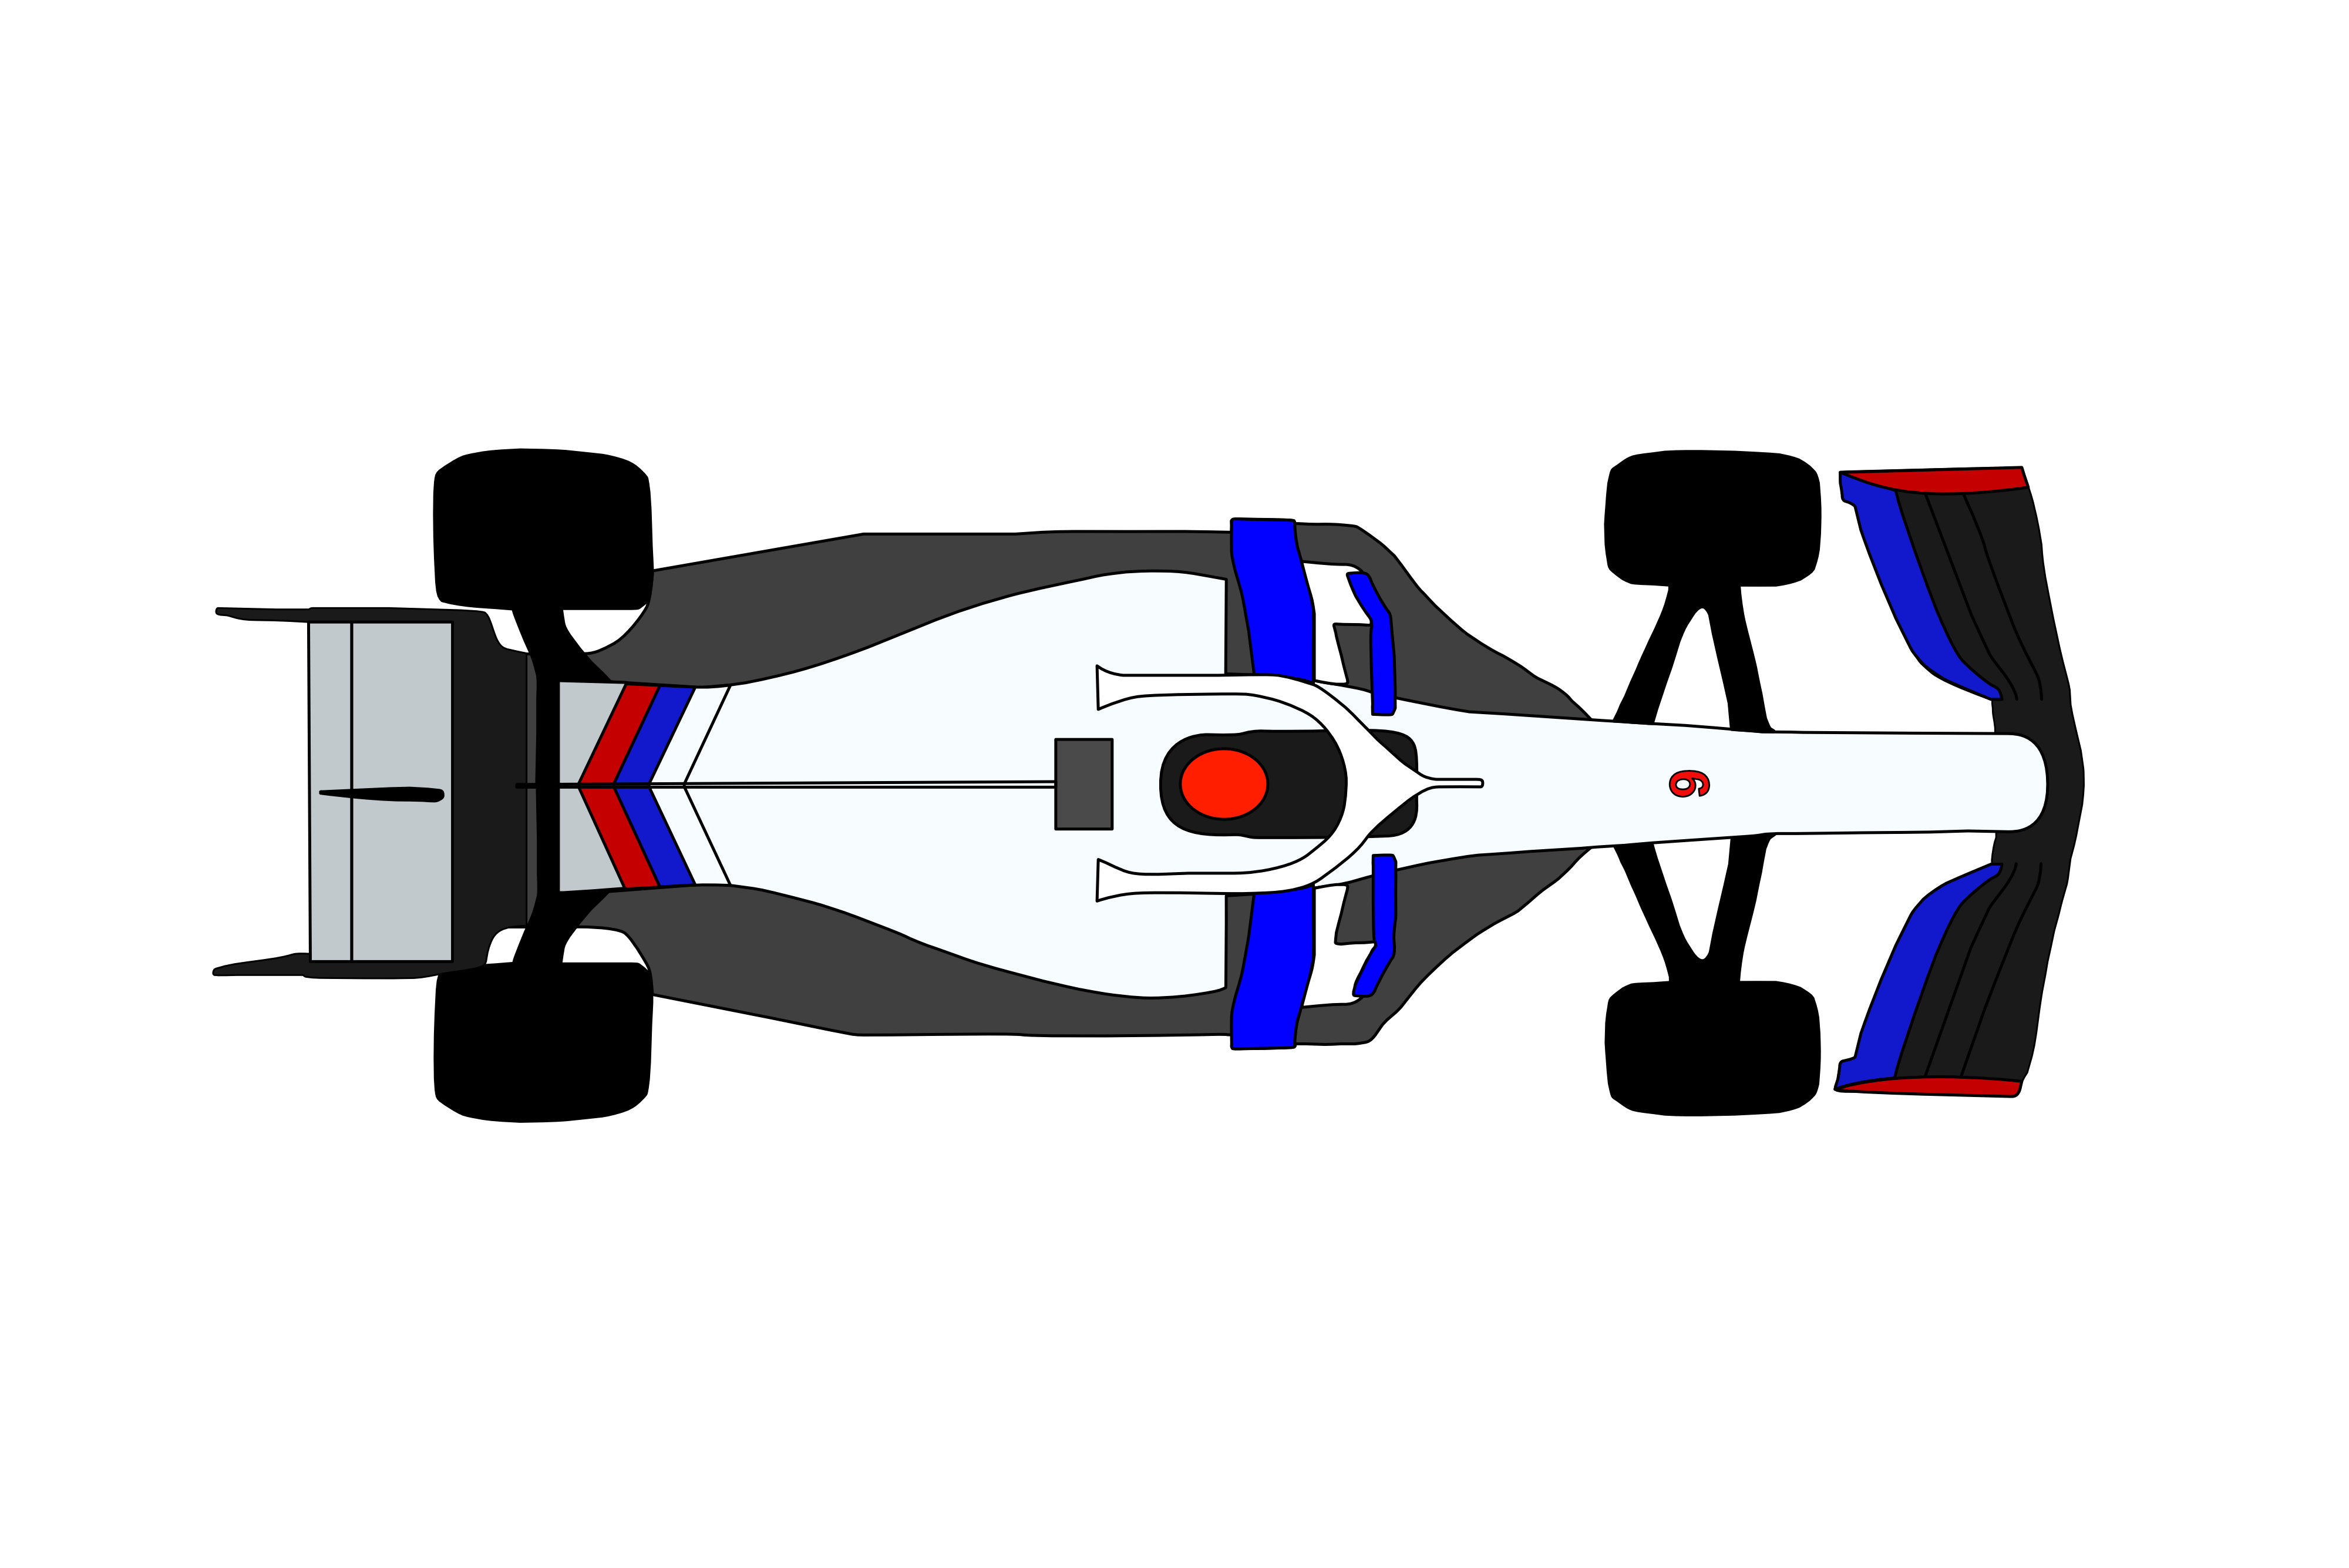
Given the intense battle throughout the 2021 Formula 1 season, I was inspired to create a data visualisation, displaying how the season evolved, showing the relative point tally of each contender in the top-10. This was done by creating line-art for each contender’s car, displaying their position in the championship on the y-axis, while the season progression is represented by the motion in the x-axis. The number of points is also displayed at any given moment, updating continuously. Albeit not immediately readable, the continuous overlapping of the opponent’s icons displays how close the championship battle has been throughout the field.
My work did therefore not only consist of representing the graphics and animations, but also to calculate the accurate subdivisions and create the art required to represent the data.
Voluntary work
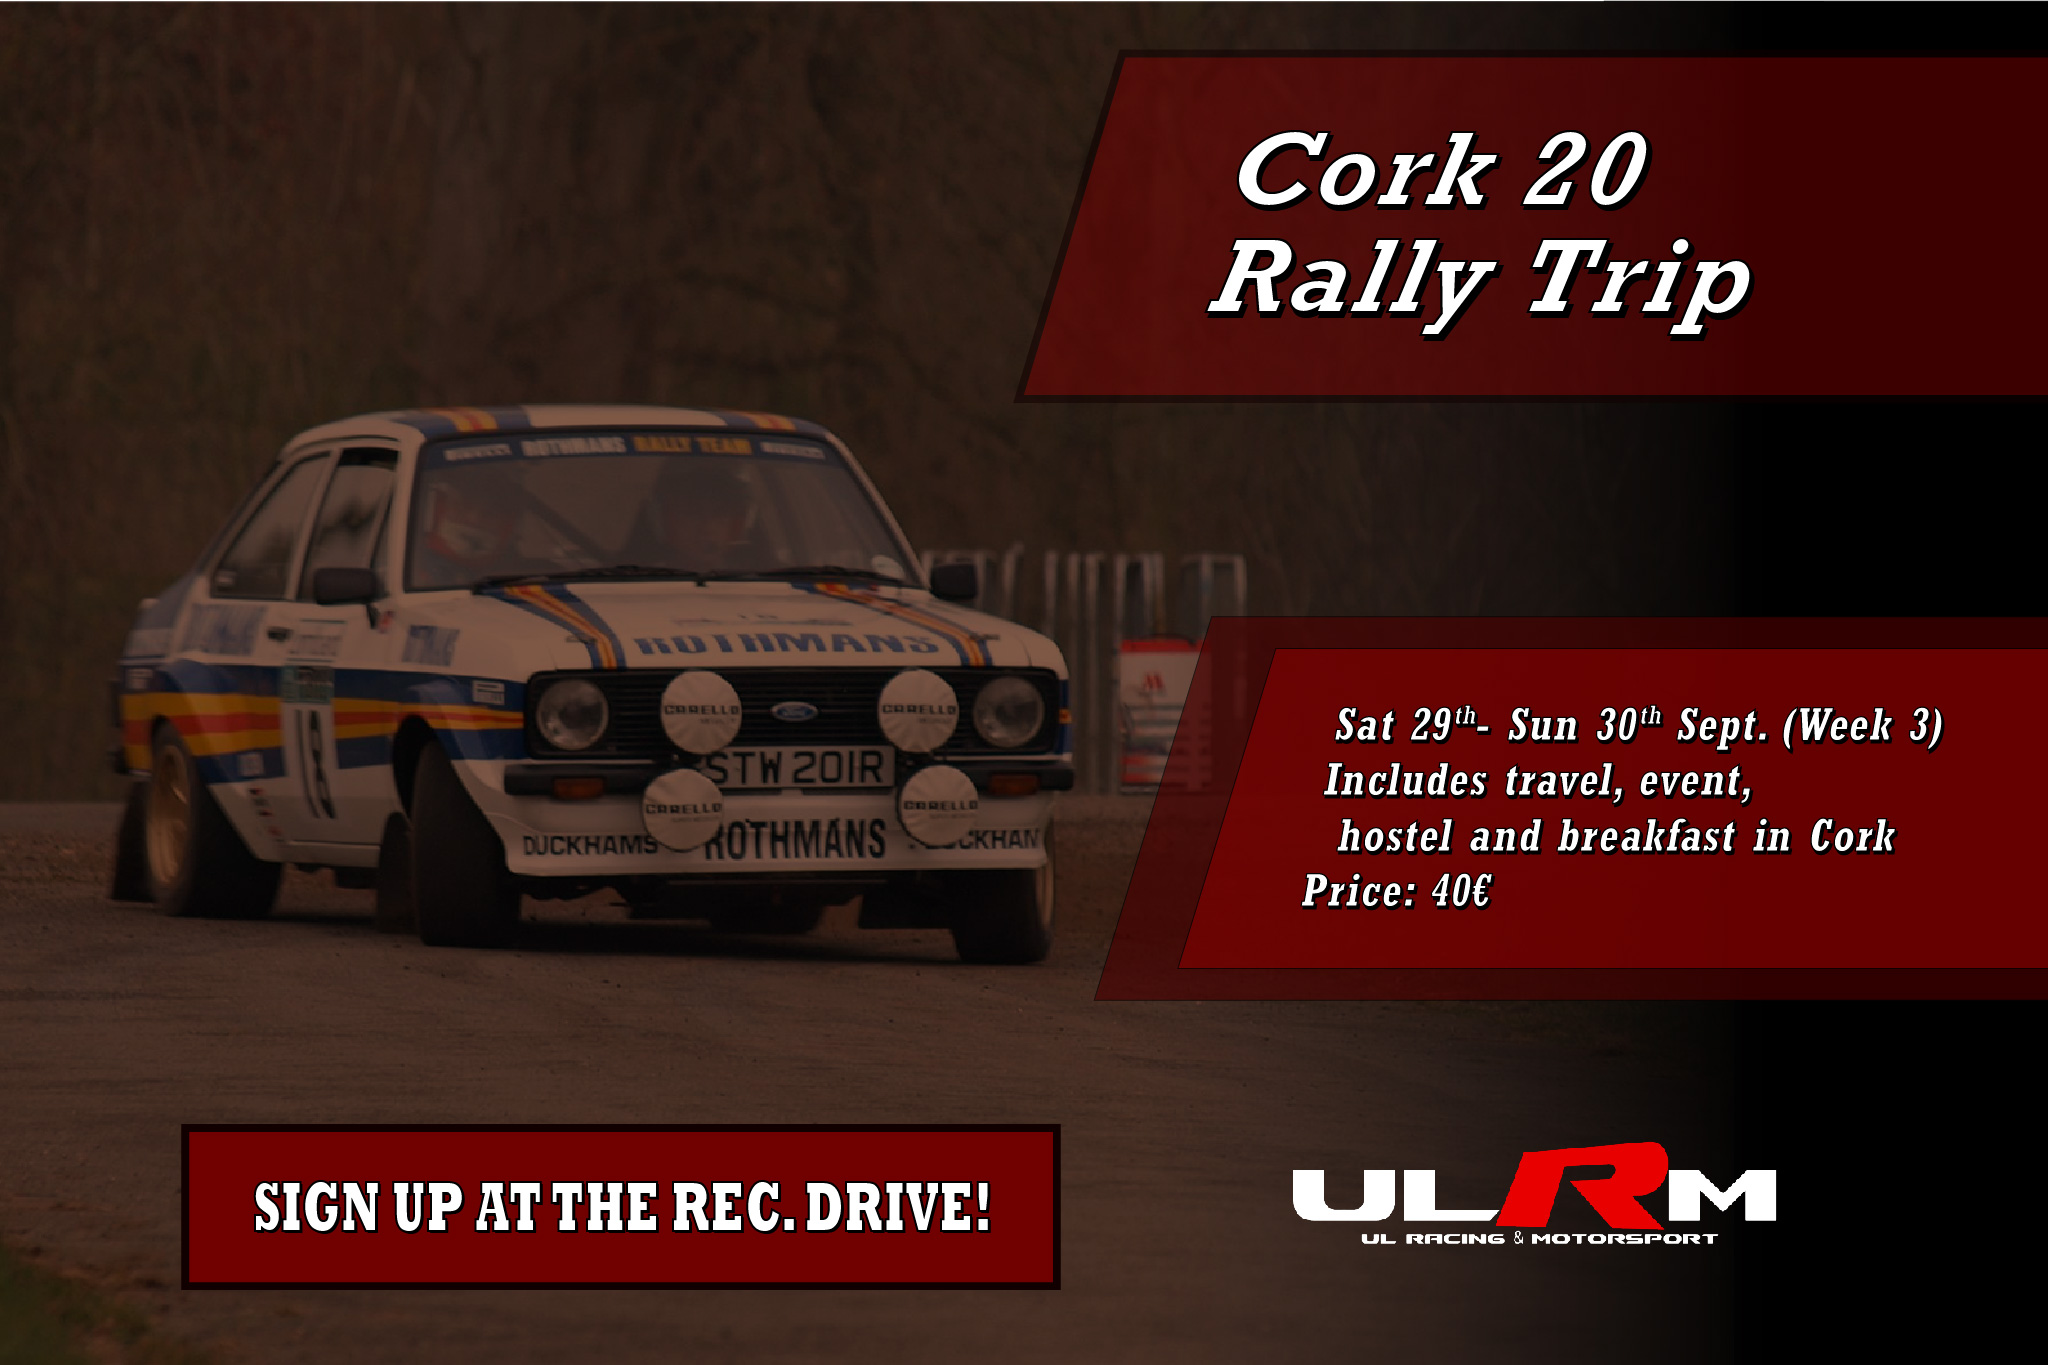
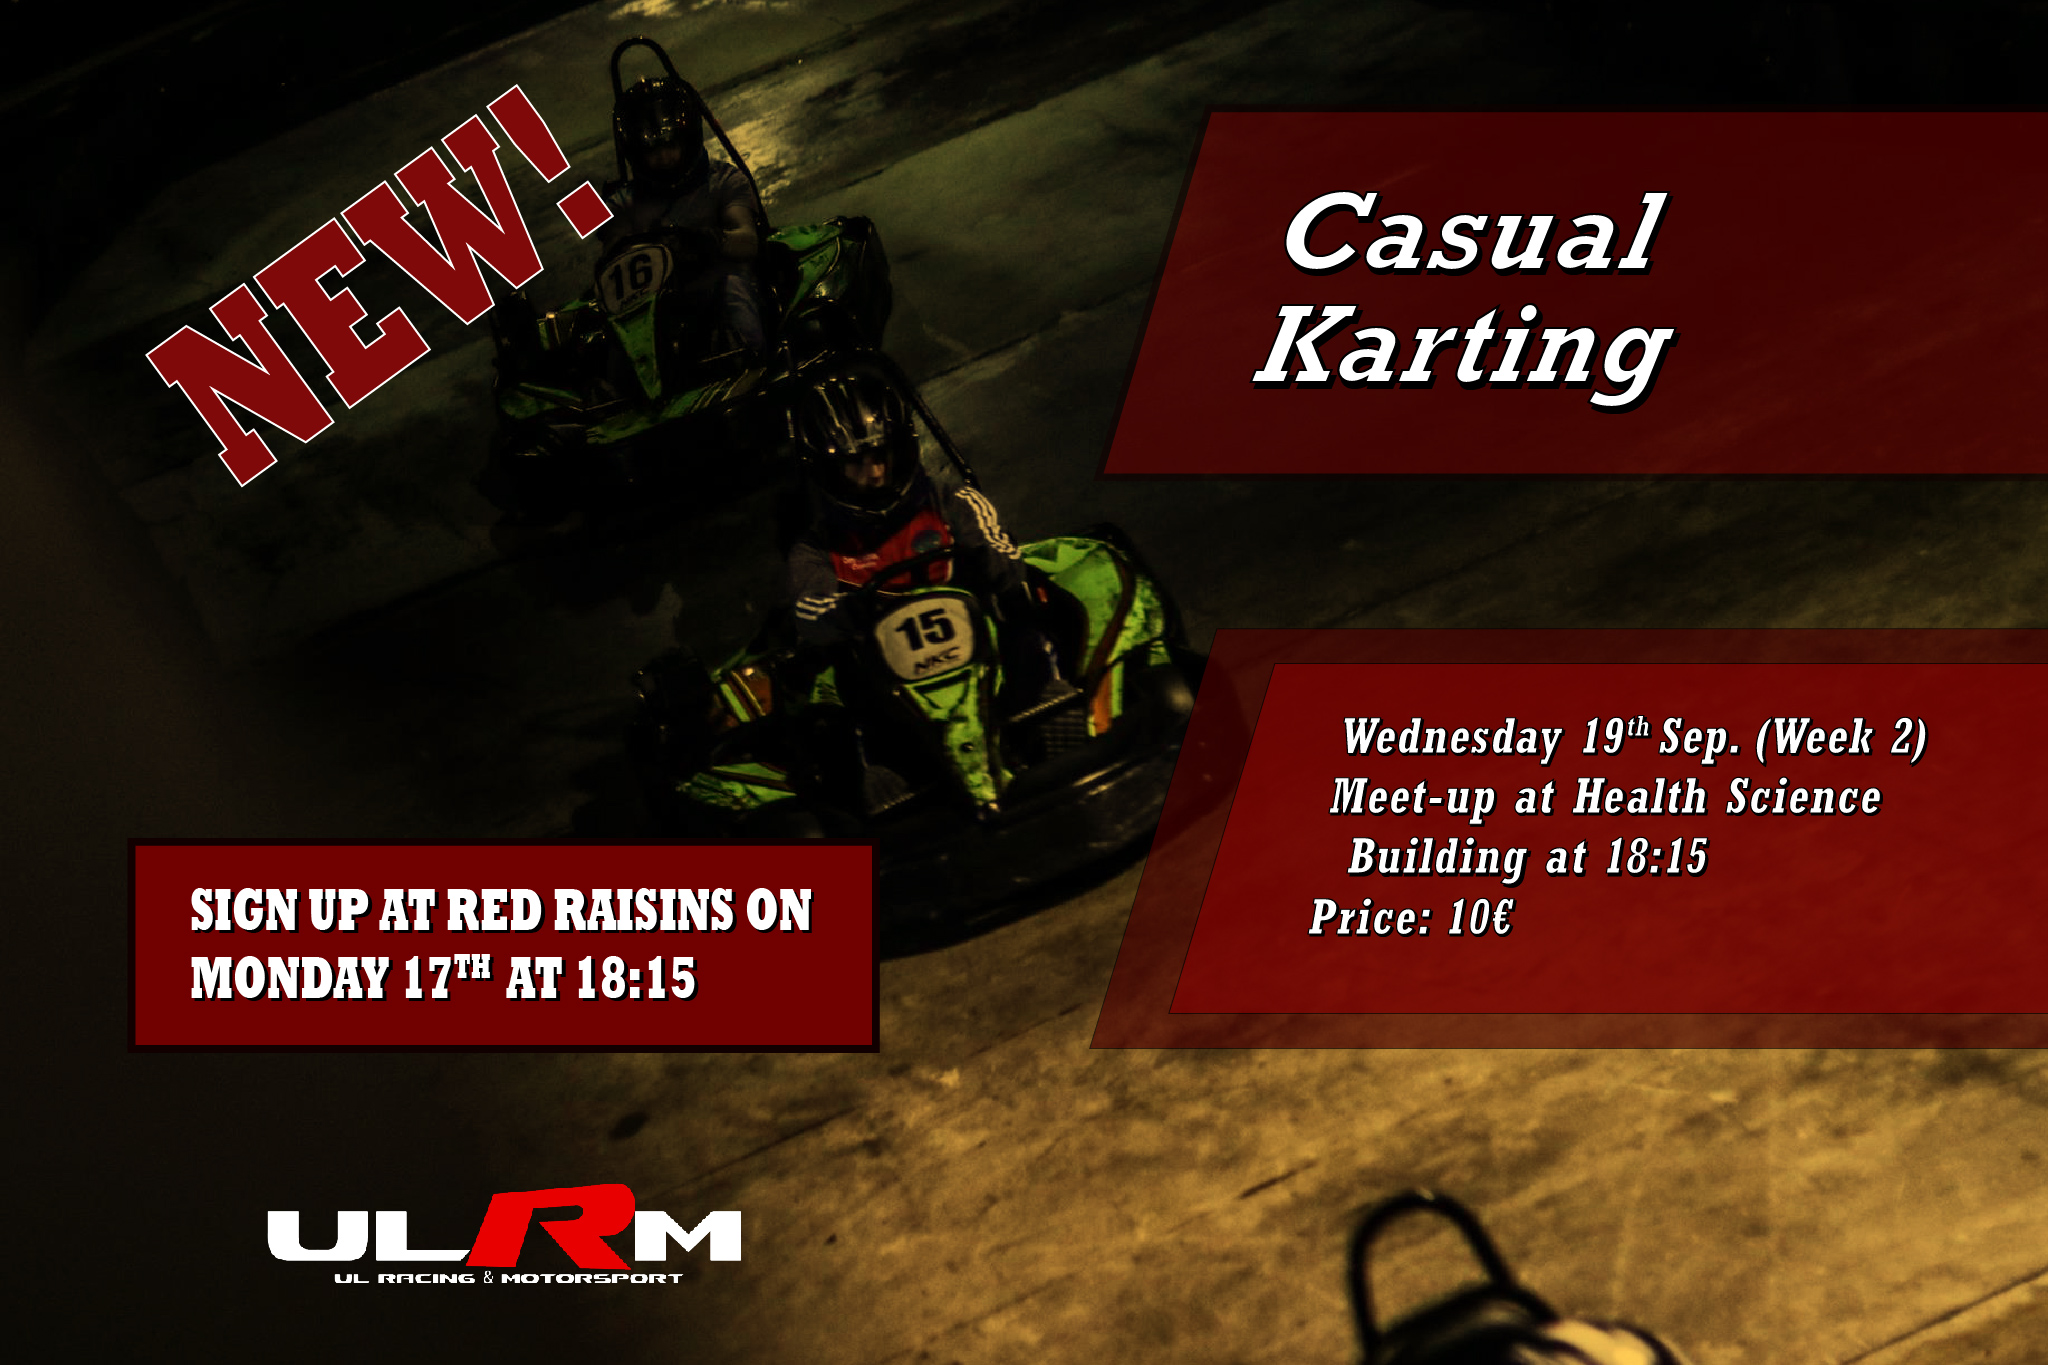
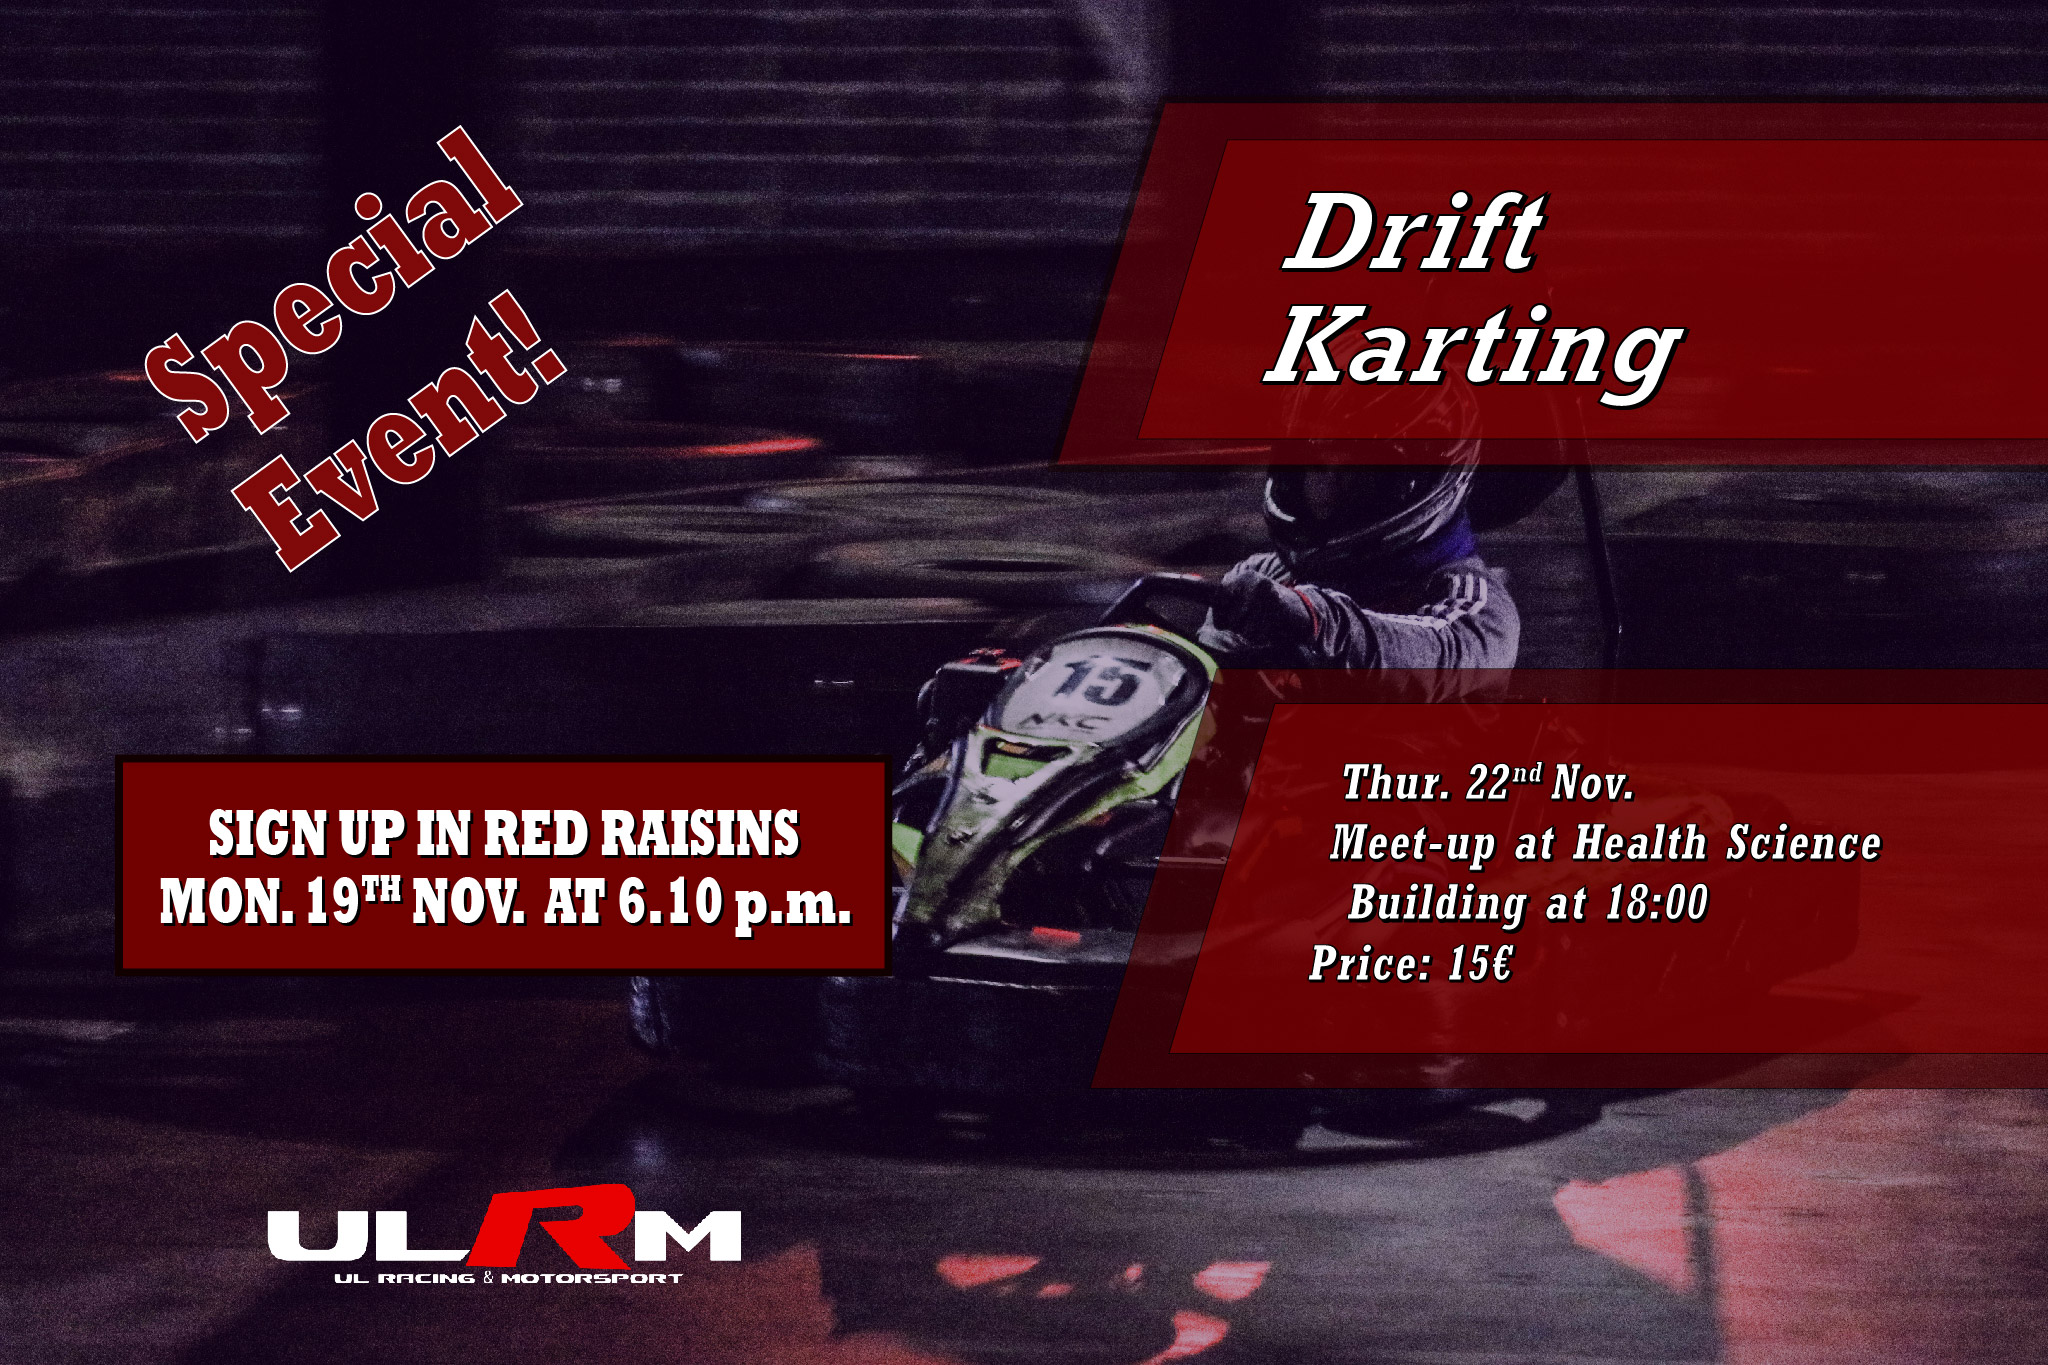
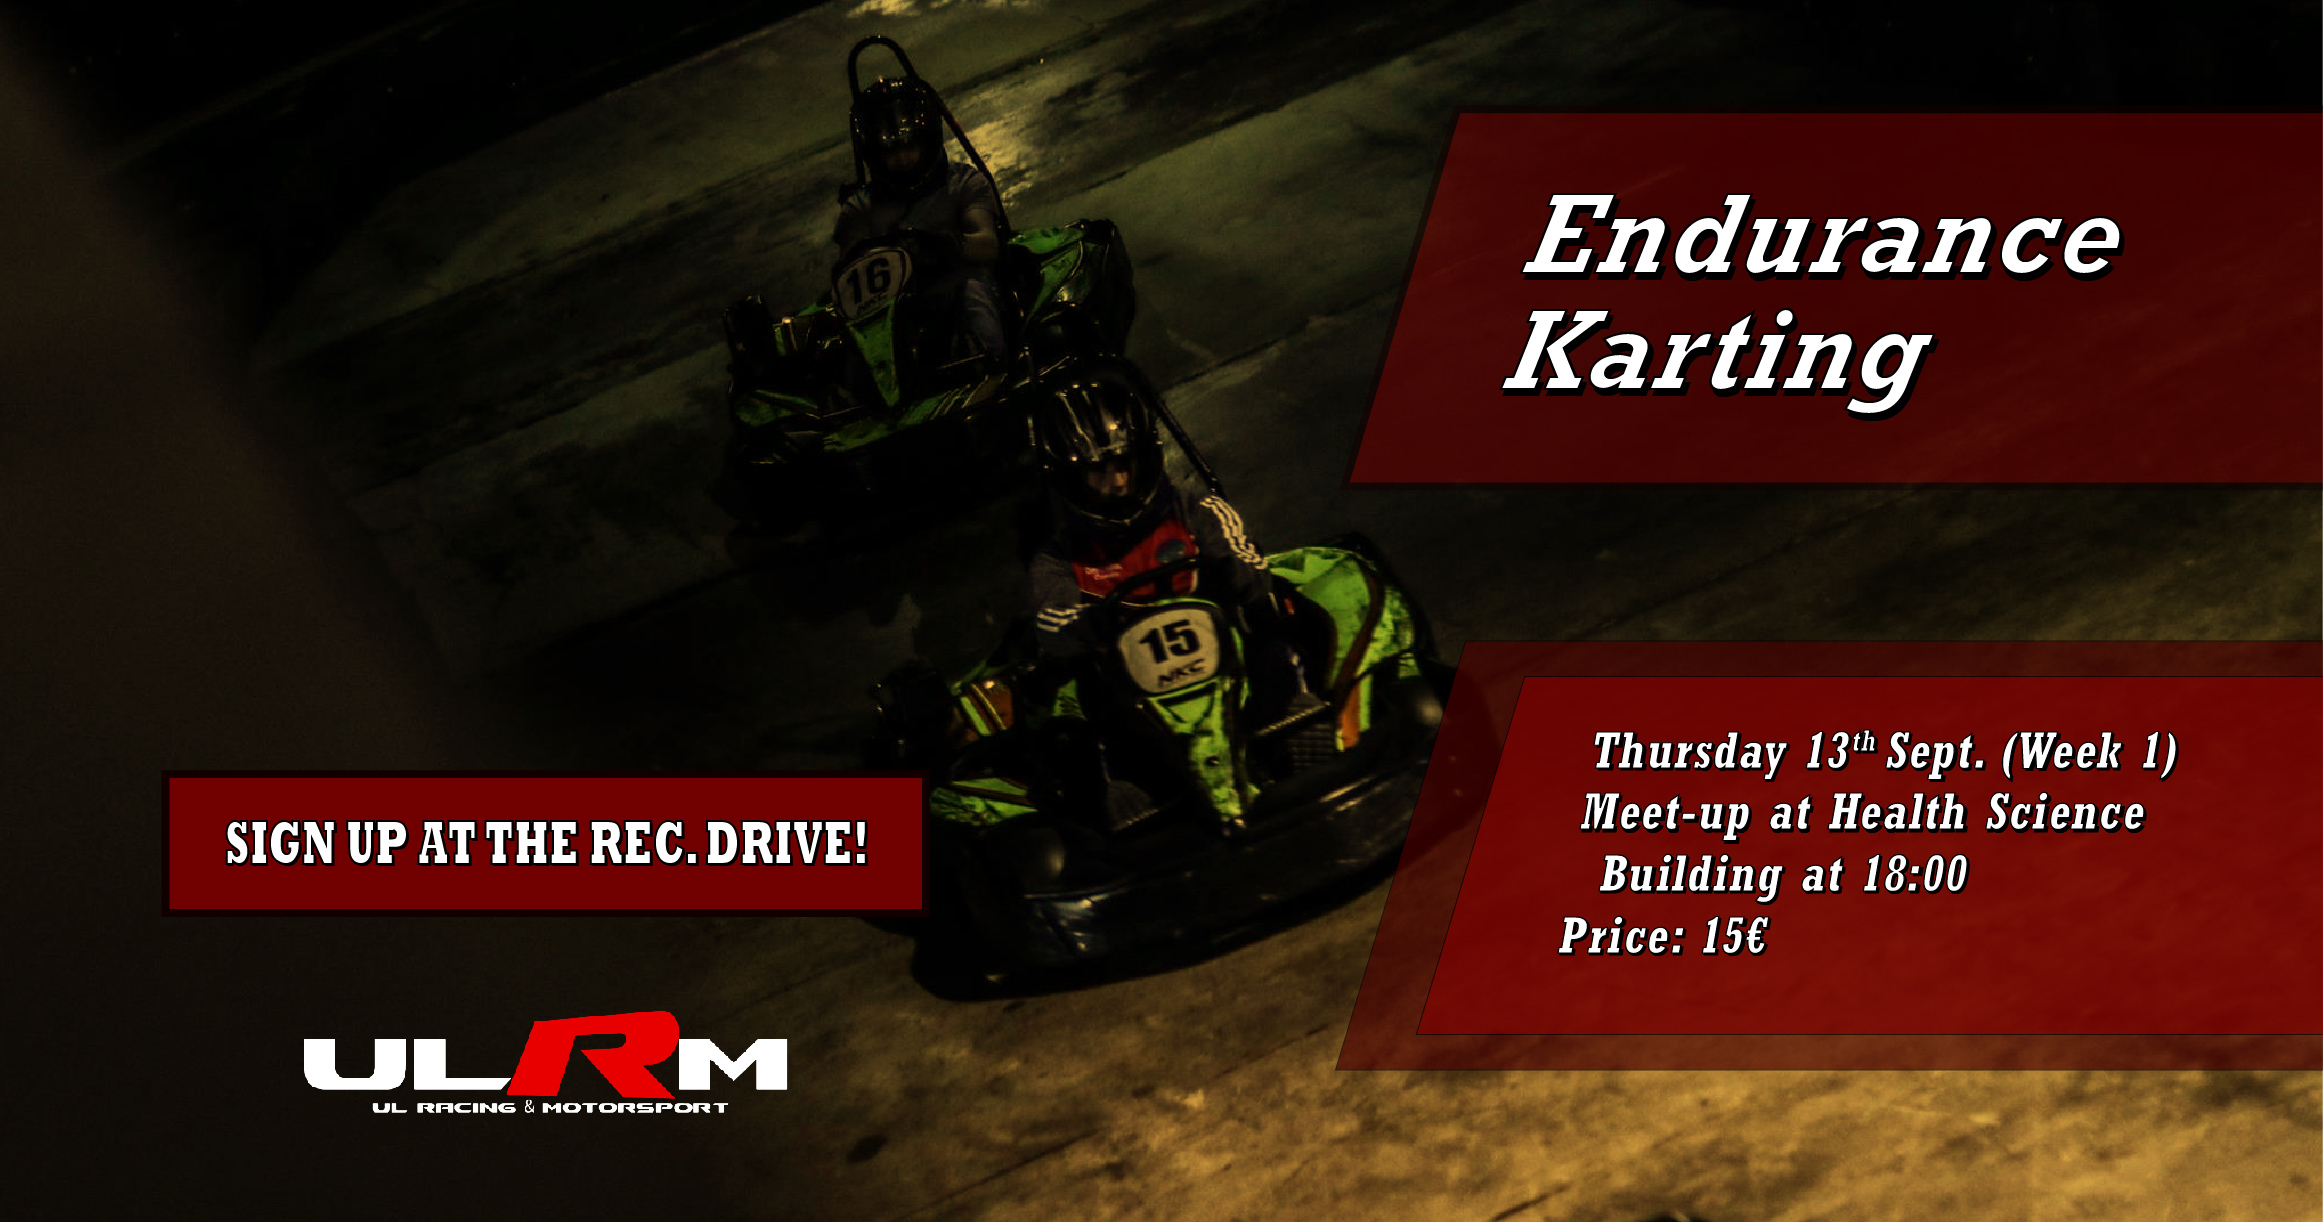
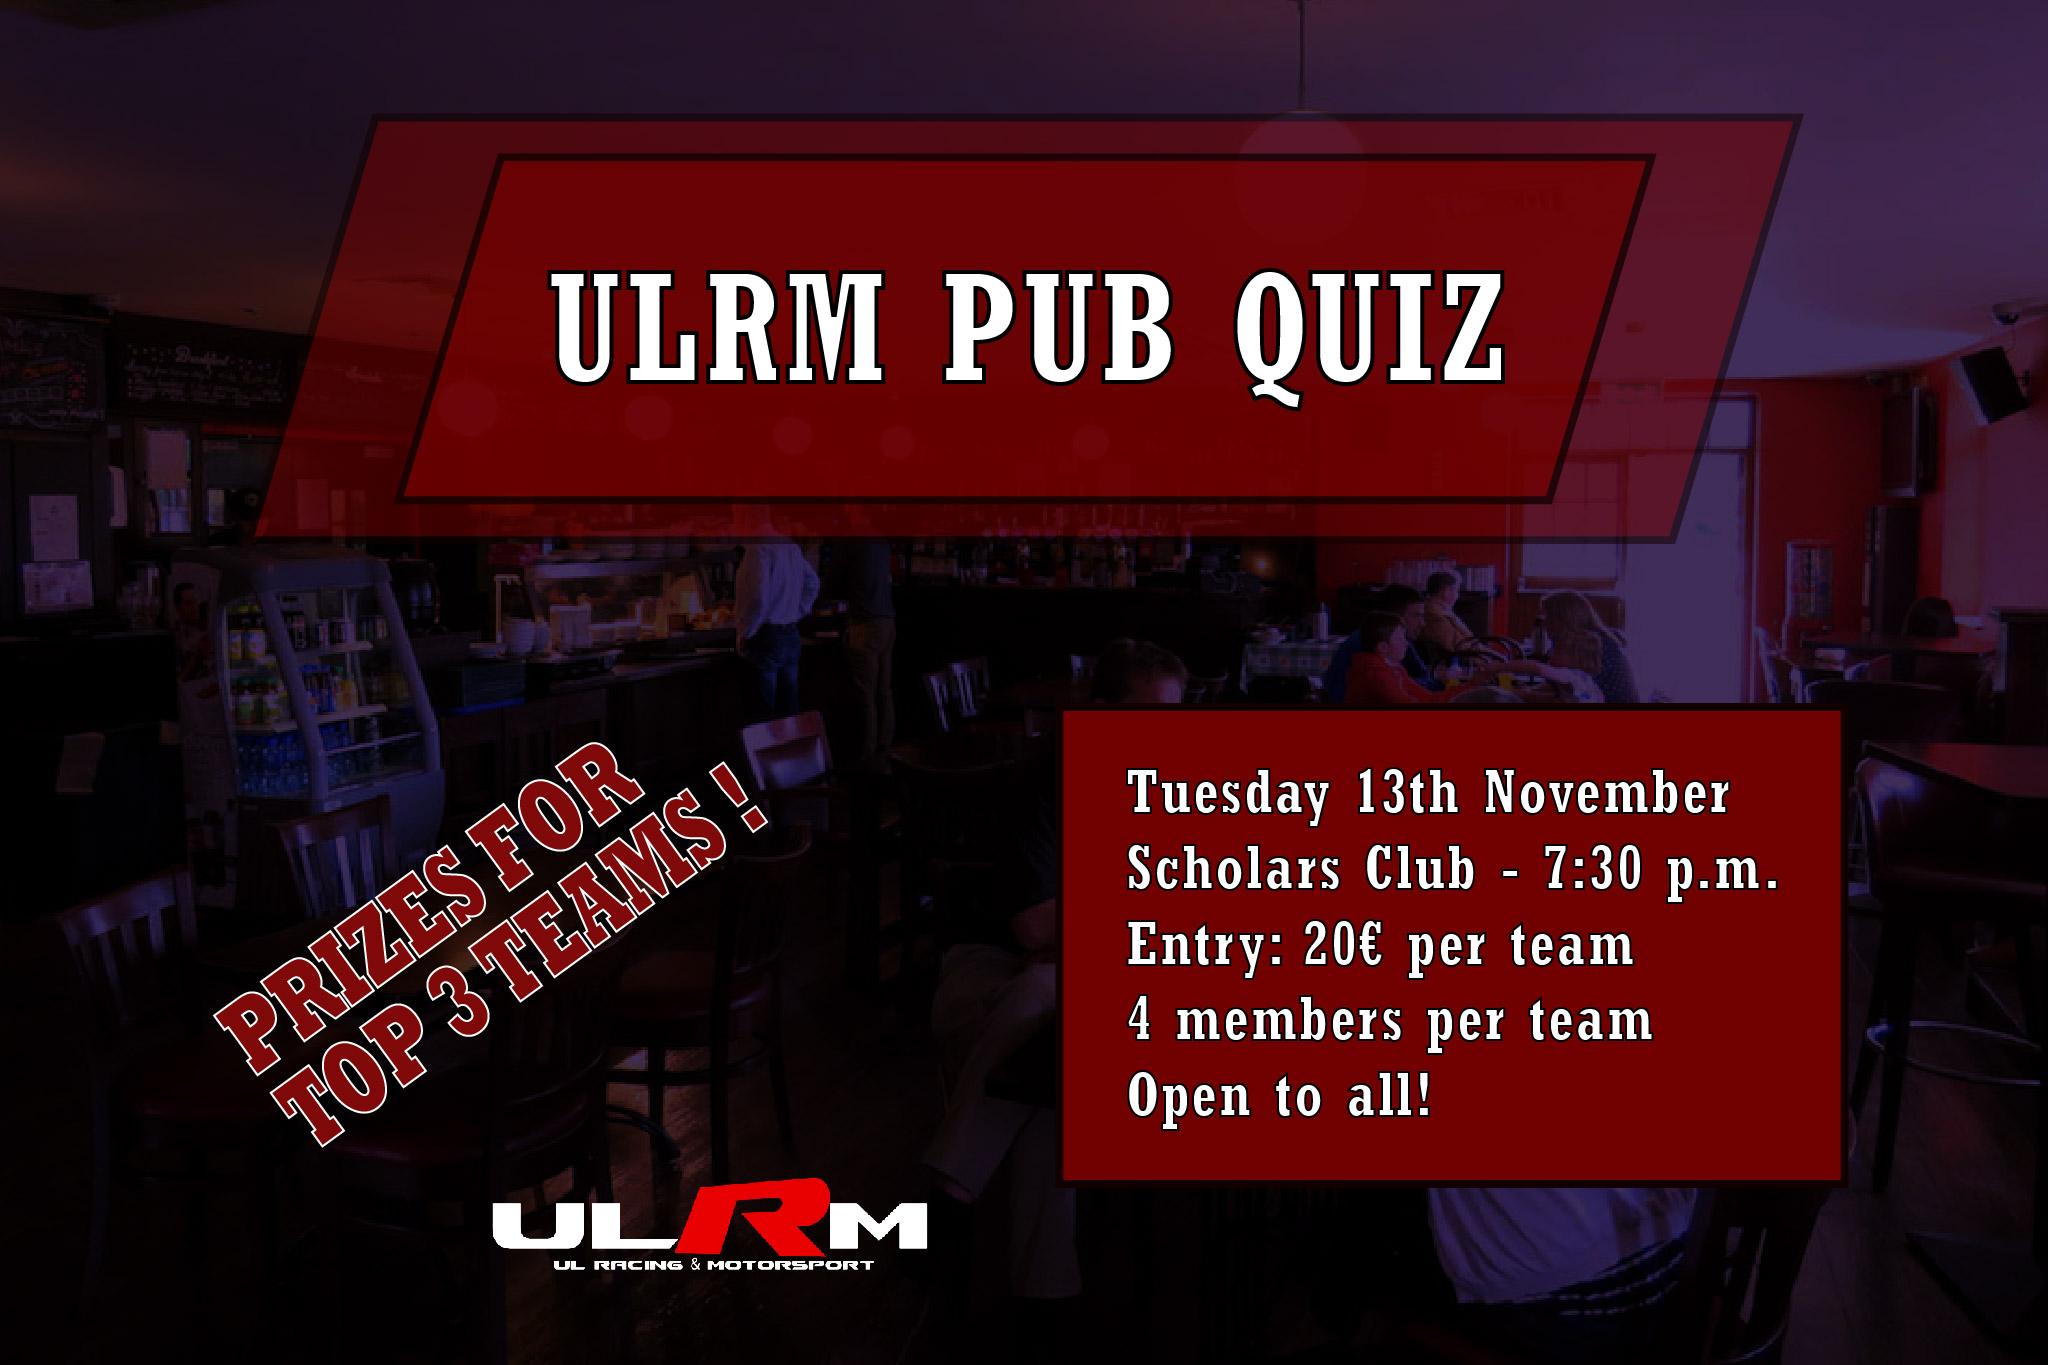
ULRM event publicity
A collection of designs I made out as part of my role in the ULRM society to publicize the events. The designs were featured on the social media outlets and in some case printed to be displayed around the university campus.